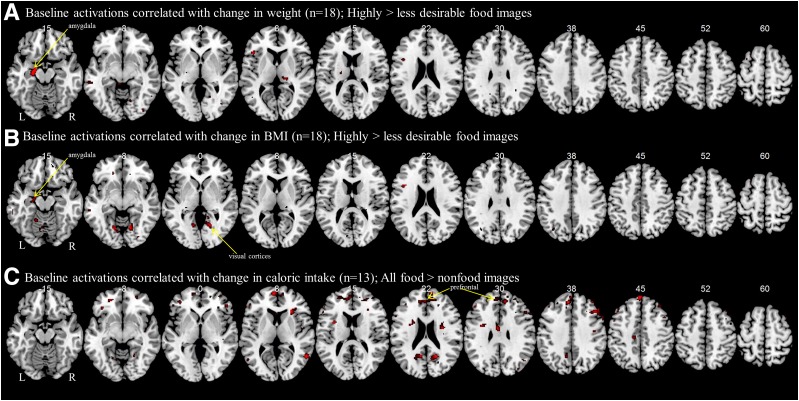
Figure 2.
Baseline predictors of efficacy with lorcaserin. Shown are results from a whole-brain regression analysis with weight loss (A), BMI decrease (B), and caloric intake (C) at 4 weeks with brain activations at baseline (week 0). Greater activation of areas shown in red at baseline (week 0) are correlated with greater weight loss, BMI decreases, or decreases in caloric intake at 4 weeks. BOLD contrasts are superimposed on a T1 structural image in axial sections from z = −15 to z = 60, in neurological orientation.

