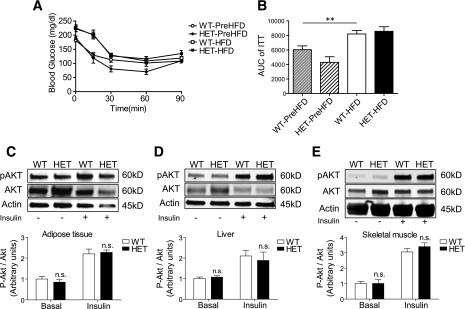
Figure 2.
HFD-fed S2HET and WT mice exhibit comparable levels of insulin sensitivity. A and B: Insulin tolerance tests were performed before (WT-PreHFD and HET-PreHFD) and after 14 weeks of HFD feeding (WT-HFD and HET-HFD), with area under the curve (AUC) analysis shown graphically. Protein homogenates from adipose (C), liver (D), or skeletal muscle (E) were obtained from saline (basal) or insulin-injected HET and WT mice fed the HFD for 16 weeks. Immunoblot analysis was performed using antibodies against phosphorylated (p)AKT (ser473), total AKT, and actin. Relative protein levels are shown graphically. Results are displayed as means ± SEM (n = 6 per group). Indicated comparisons are significantly different: **P < 0.01; n.s. indicates that no significant differences were observed between groups.

