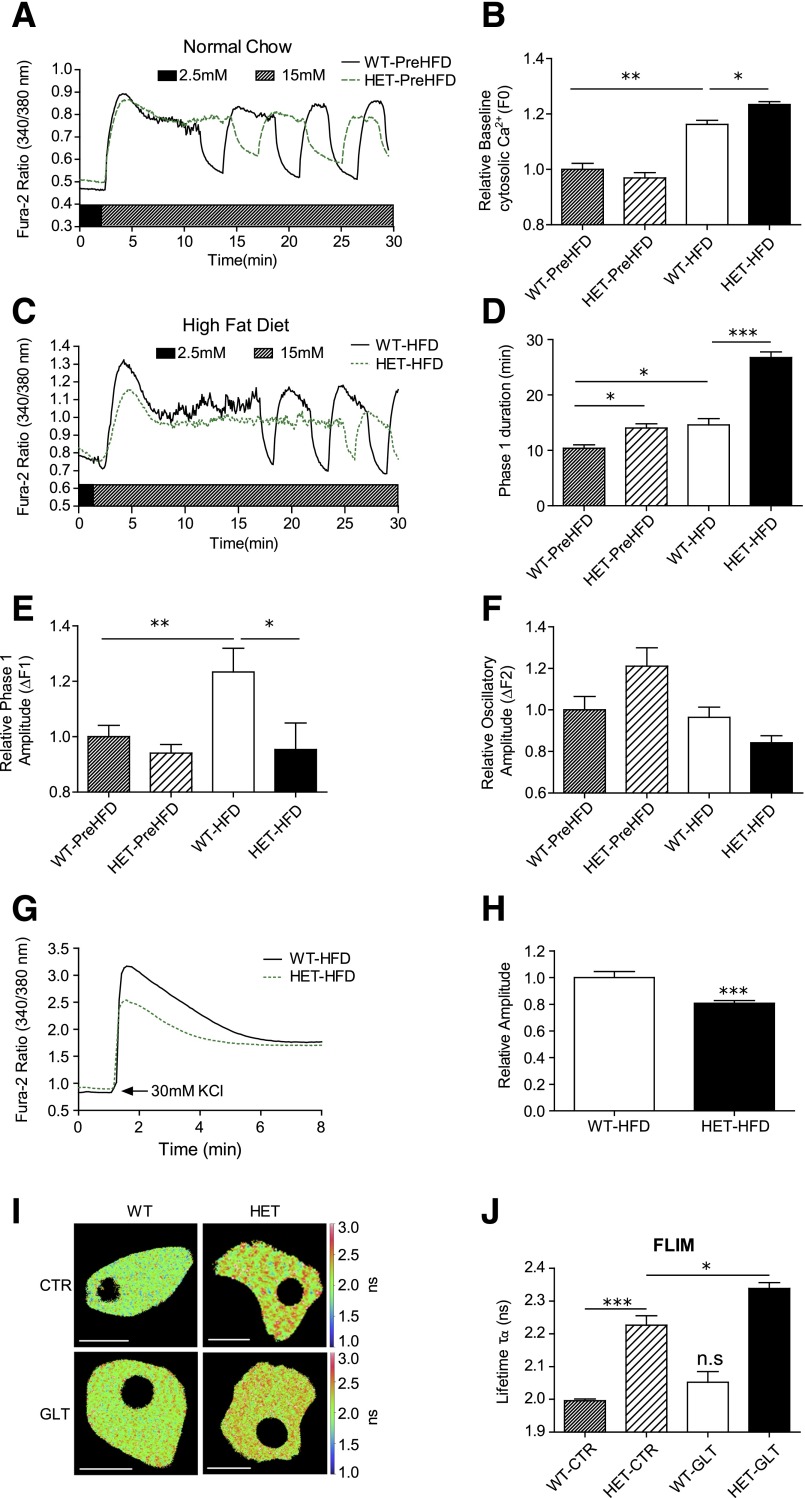
Figure 4.
Islets isolated from S2HET mice exhibit impaired Ca2+ homeostasis. Islets were isolated from 8-week-old PreHFD-WT mice or WT mice fed the HFD for 16 weeks and 8-week-old PreHFD-S2HET mice or S2HET mice fed the HFD for 16 weeks. Isolated islets were loaded with Fura-2 AM, and Ca2+ imaging was performed. A and C: Representative cytosolic Ca2+ recording of islets after stimulation with 15 mmol/L glucose. B: Quantification of the relative basal cytosolic Ca2+ (F0) in WT and HET islets. D: Quantification of the phase 1 duration. E: Quantification of the phase 1 cytosolic Ca2+ amplitude. F: Quantification of the average cytosolic Ca2+ oscillatory amplitude from five continuous oscillatory cycles per islet. G: Representative cytosolic Ca2+ recording from WT-HFD and HET-HFD islets after stimulation with 30 mmol/L KCl. H: Quantification of the phase 1 cytosolic Ca2+ amplitude in response to KCl (n = at least 26 islets from 3 biological replicates per group for A–H). I and J: Dispersed islets were transduced with a D4ER adenovirus, and FLIM was used to measure ER Ca2+. Representative lifetime map with lookup table indicating donor lifetime in ns (scale bar = 10 µm) and average donor lifetime in PreHFD-WT and S2HET β-cells treated under control (CTR) or GLT conditions (n = at least 10 cells per condition). Results are displayed as means ± SEM. Indicated comparisons are significantly different: *P < 0.05; **P < 0.01; ***P < 0.001; n.s. indicates that no significant differences were observed between groups.

