Figure 8.
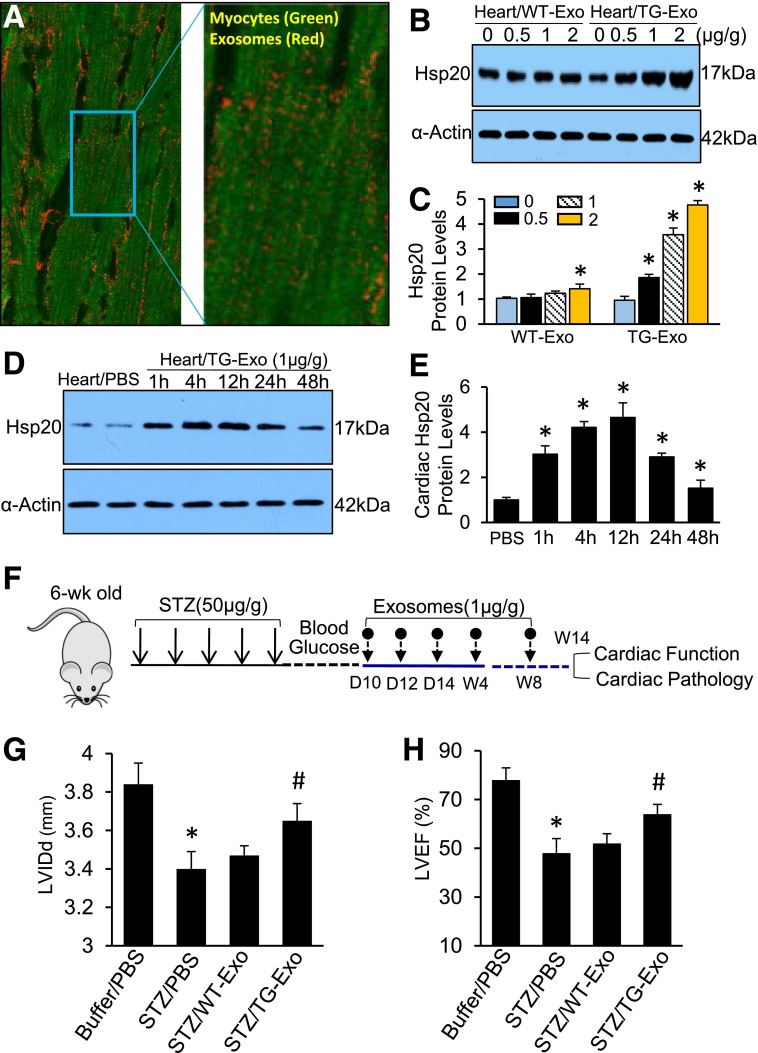
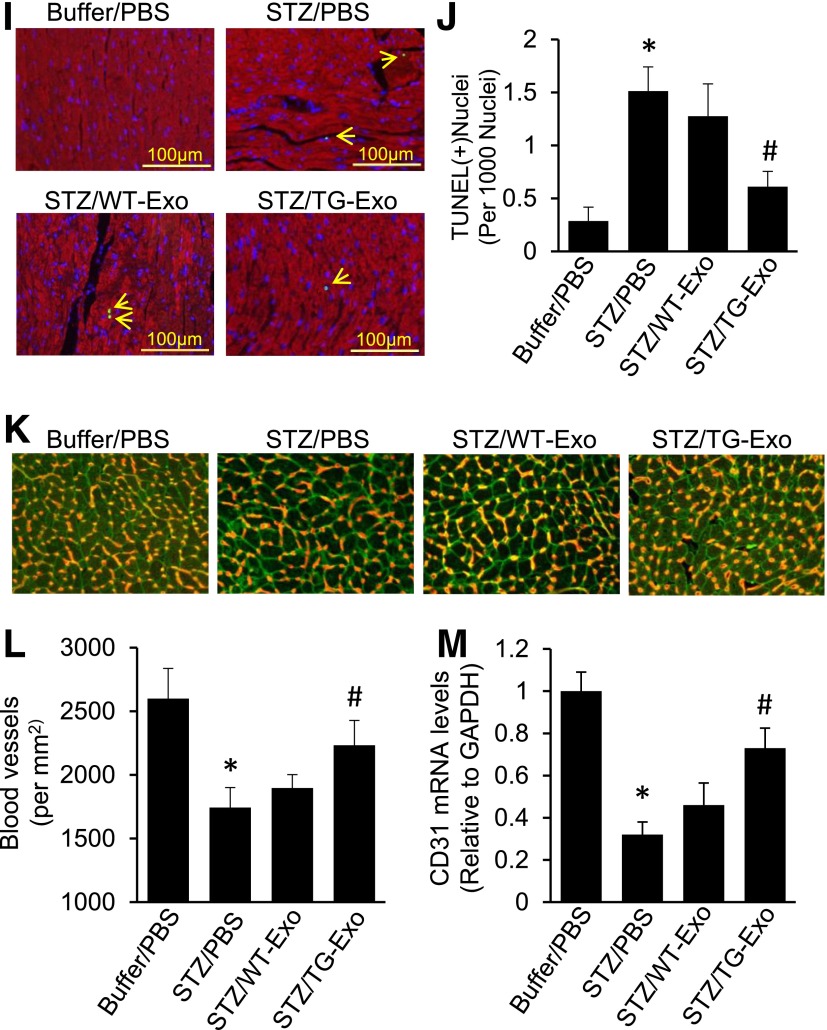
Injection of Hsp20-enriched exosomes collected from TG cardiomyocytes protects mice against STZ-induced cardiac adverse remodeling. A: DiR-labeled cardiomyocyte-derived exosomes were detectable in mouse cardiomyocytes 1 h after the tail-vein injection in vivo. The right image is magnified from insert square of A. B and C: Exosomal Hsp20 was dose-dependently delivered to the mouse heart after the tail-vein injection. D and E: The time course determination of cardiac Hsp20 levels in TG-Exo–injected mice. F: A scheme of the experimental procedure for the exosome injection in STZ-treated mice. G and H: LVIDd and LVEF% were significantly improved in TG-Exo–injected diabetic mice (n = 5–8). *P < 0.05 vs. buffer/PBS group; #P < 0.05 vs. STZ/PBS group. Full echocardiographic data are listed in Supplementary Table 3. I: Representative TUNEL staining images (red, α-sarcomeric actin for cardiomyocytes; blue, DAPI for nuclear staining; green, apoptotic nuclear; arrows indicate TUNEL-positive nuclei) and quantification results (J) (n = 5 hearts, two sections per heart). *P < 0.05 vs. buffer/PBS group; #P < 0.05 vs. STZ/PBS group. K: Representative merged images of WGA staining (cardiomyocytes, green) and iB4 staining (blood vessels, red). L: The quantified density of myocardial blood microvessels (n = 5 hearts, two sections per heart, detected at low magnification, ×200) (L) and further confirmed by RT-PCR analysis for CD31 expression (n = 5) (M). *P < 0.05 vs. buffer/PBS group; #P < 0.05 vs. STZ/PBS group. D, day; W and wk, week.


