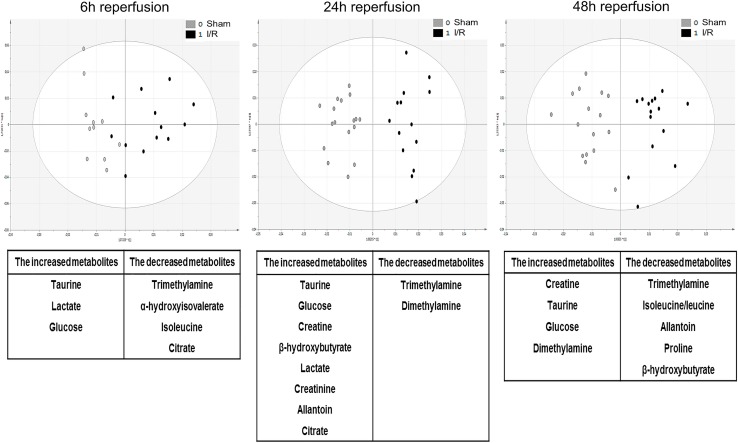
Fig 2. Score plots from OPLS-DA applied to 1H-NMR spectra of mouse urine samples following renal ischemia/reperfusion or sham surgery.
The upper panels represent the score plots of OPLS-DA from 1H-NMR metabolomic analysis using mouse urine samples collected after 6-hour (left), 24-hour (middle) and 48-hour (right) reperfusion following renal ischemia (black dots) or sham surgery (grey dots). The lower tables correspondingly list the metabolites whose urinary abundance is significantly increased or decreased after renal ischemia/reperfusion (I/R) in comparison to sham surgery.

