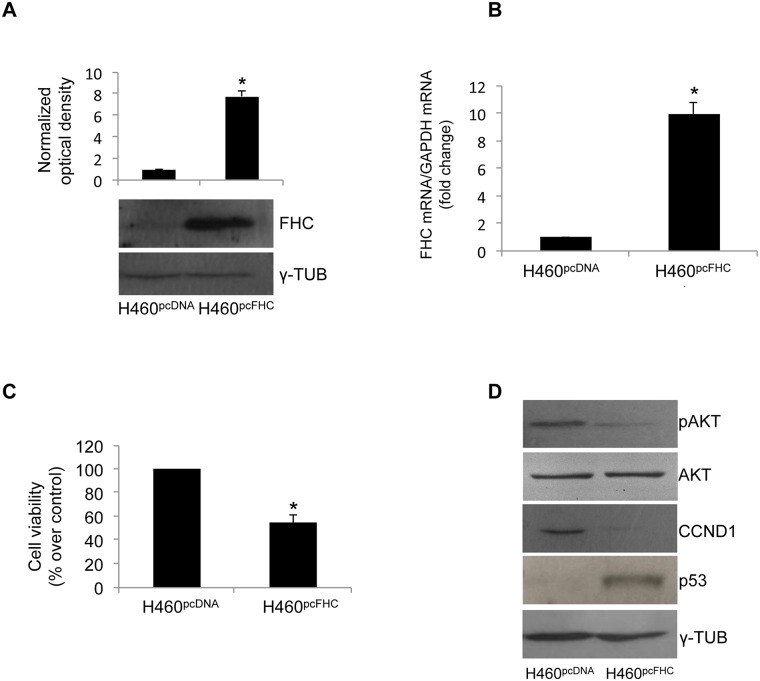
Fig 2. FHC over-expression reduces cell proliferation.
(A) Western blot analysis for FHC was performed on 50μg of total proteins extracted from H460 over-expressing FHC (H460pcFHC) and H460 control cells (H460pcDNA). γ-Tubulin was used as a loading control. Blots are representative of three independent experiments. The graph representsthe mean of the optical densities (*p < 0.001 compared with control cells). (B) Real-time PCR analysis of FHC mRNA levels was performed on total RNA from H460pcFHC and H460pcDNA. Results are representative of three different experiments (* p<0.05 compared with H460pcDNA). (C) Cell proliferation was assessed using the MTT method as indicated in the Materials and Methods section. Final results represent mean ± SD of three independent experiments each performed in octuplicate (*p< 0.05 compared with H460pcDNA). (D) Western blot analysis for CCND1, p53 and pAKT were performed on 50 μg of total proteins extracted from H460pcFHC and H460pcDNA. Blots are representative of three independent experiments. γ-Tubulin and AKT were used as loading controls.

