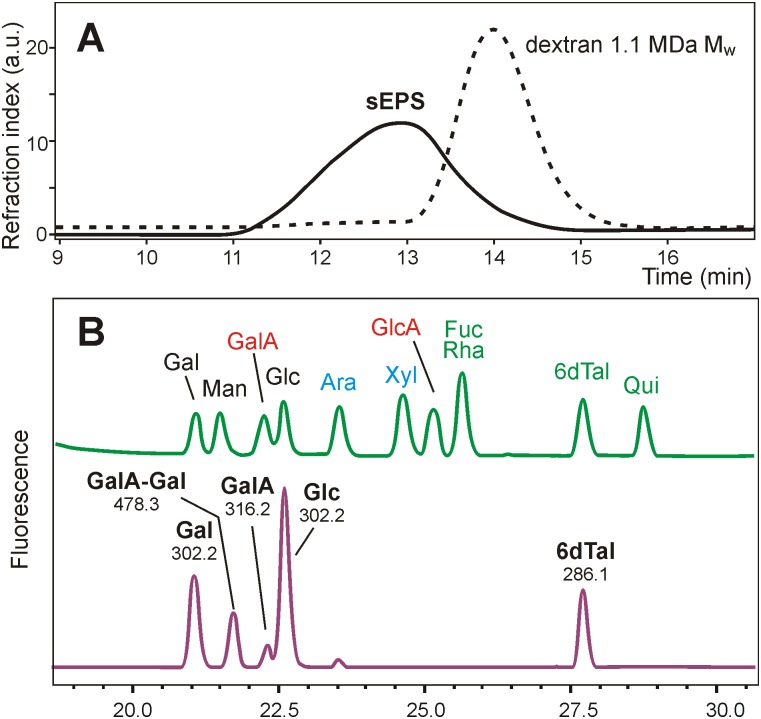
Fig 4. B. longum 35624 EPS characterization.
(A) Comparison of the EPS (solid line) with a dextran standards dotted line) demonstrated that EPS had an average molecular mass much higher than 1 MDa (Mw). (B) HPLC analysis of anthranilic acid-labeled monosaccharides of EPS revealed the presence of glucose (Glc), galactose (Gal), some galacturonic acid (GalA) and two additional peaks with masses corresponding to an aldobiuronic acid and a deoxy-hexose later identified as 6-deoxy-talose. The upper trace in (B) is the standard mixture and the lower trace shows the results of the EPS sample. Numbers in the lower trace give the masses of the compounds as determined by off-line ESI-MS.

