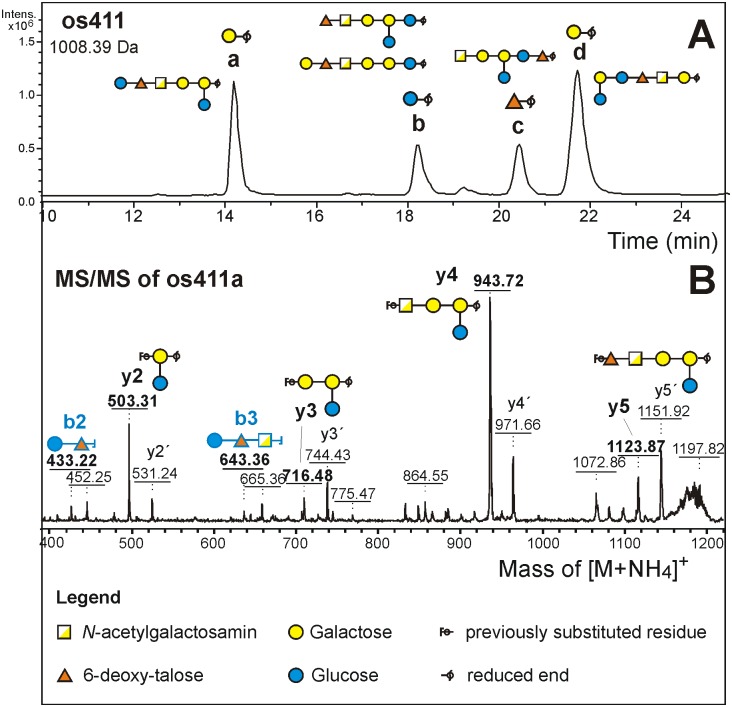
Fig 5. Mild acid hydrolysis of EPS.
(A) Separation of EPS fragments by PGC HPLC with MS/MS detection. The extracted ion chromatogram for mass 1008.39 Da shows four peaks. Their reducing end sugar was clearly revealed by ESI-MS/MS. Their assignment as either Gal or Glc and the interpretation in terms of fragment structures was done a posteriori based on MALDI-TOF data and on knowledge of the EPS structure. (B) Example of a MALDI-TOF/TOF fragment spectrum showing b-ions from the non-reducing and y- and y´ (= 1,5x) -ions from the reducing end.

