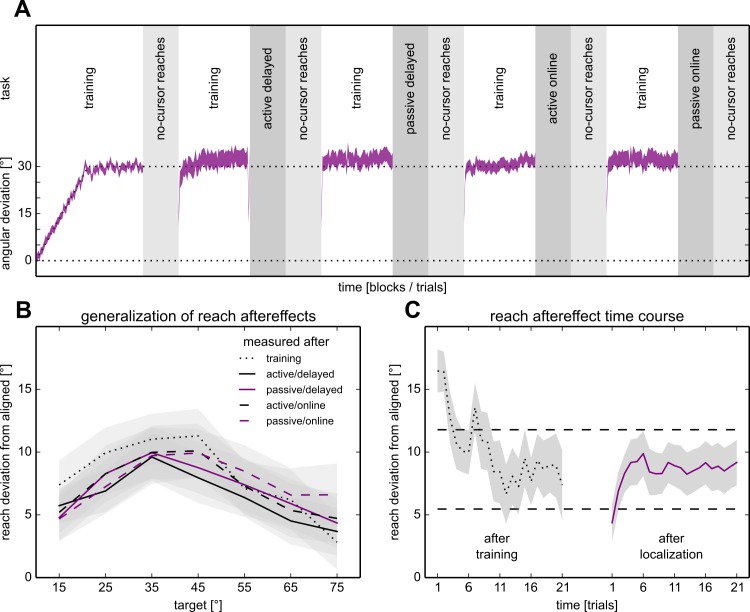
Fig 2. Time course, and reaching results, of the experiment.
A, top: task/block order. Each session started with a longer training block. The four localization tasks were performed after a block of training and before a no-cursor reach block. The order was similar for the aligned and rotated sessions, but the rotated sessions had an extra no-cursor reach block and training block after the initial training block. A, bottom: Hand movement direction while reaching during the rotated session. The average angle at the point of peak velocity over trials (purple area in the training blocks denotes the average across participants ± SEM) shows that participants adapted their reaching movements to rotated visual feedback in step with the gradually introduced rotation of visual feedback. Reach aftereffects are shown in the no-cursor reach blocks. The curves go from the target at 15° (at the left side of the curve) to the target at 75° in order, and the circles denote the aftereffects at the 45° target, the only target used during training. B: Generalization of reach aftereffects. The difference between the average reach endpoint angles in each of the no-cursor blocks done after rotated training, corrected for the average reach endpoint angles across all the no-cursor blocks done after aligned training. Gray areas represent the standard error of the mean. Note that the effect is strongest at the trained target, and decreased for targets further away. Also, the reach aftereffects measured immediately after training are slightly larger than those in the other blocks. C: Time course of reach aftereffects. Left: On the very first trial following training, reach aftereffects are about twice as large as at the end of that block. Right: Except for some initial errors, the reach aftereffects measured on the central three targets seems stable in the no-cursor reach blocks following localization. Gray areas indicate standard error of the mean, dashed lines indicate the 95% confidence interval for responses in the blocks after localization.

