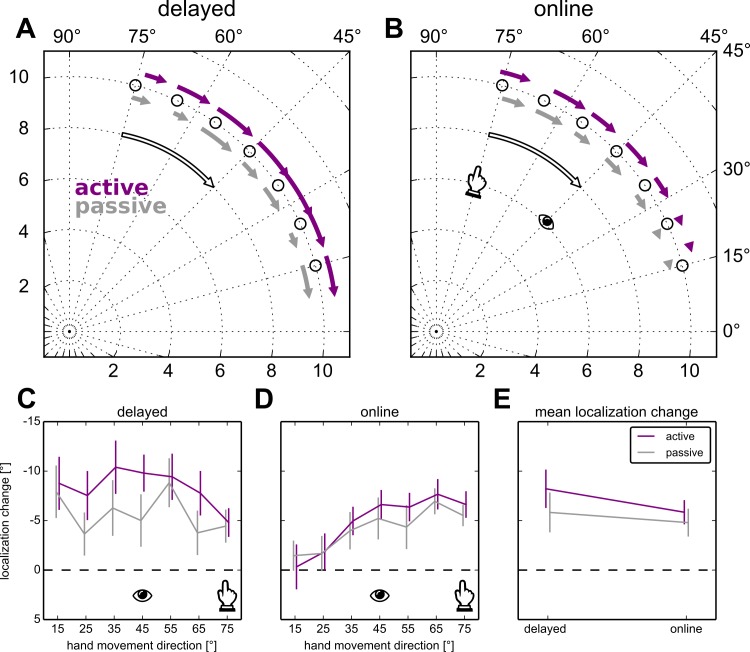
Fig 3. Localization results.
The change in the touchscreen responses in the four variations of the localization task, using 10° bins centered on the reach targets (circles) in the no-cursor reach block. Active localization is shown in purple, passive localization in gray. The eye-icons illustrate the direction of the target during training, and the hand icons illustrate the direction of movements required to hit the target with 30° rotated visual feedback. A,C: Delayed localization, B,D: Online localization. A,B: The beginning and end of the arrows show the average deviation from the true reach angle in that bin before and after visuomotor adaptation, respectively. The open arrow illustrates the visuomotor rotation. E: The average change in the direction of hand localization across bins and participants.

