
Figure 3.
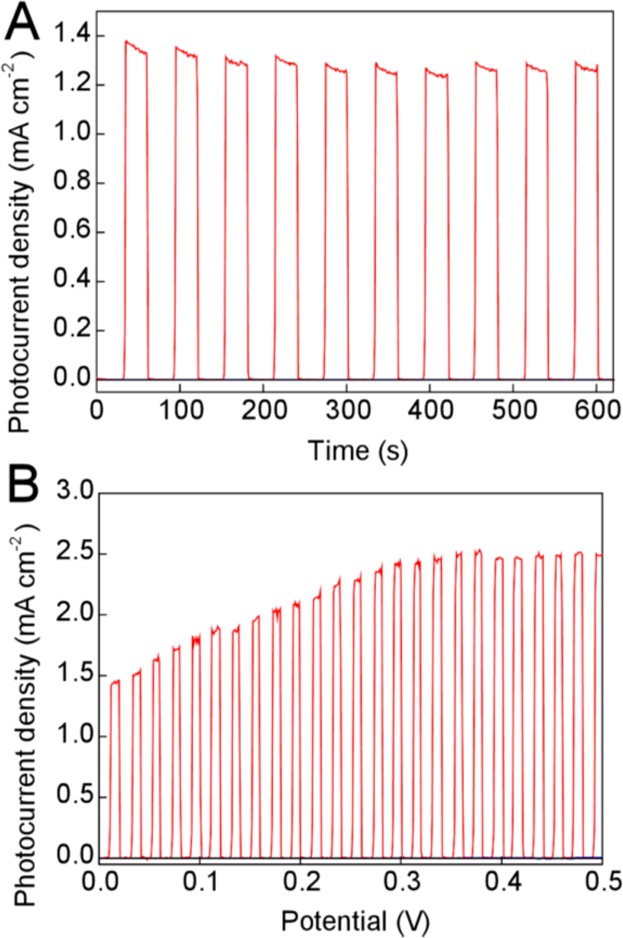
(A) Chopped light experiment in a two-electrode configuration at 0 V bias, according to the cell setup in Figure 2 (red line). Black line: with H3PMo12O40 but using only FTO as the anode. Blue line: with a WO3-FTO anode, but using no ECPB. (B) Chopped light experiment in a two-electrode configuration, as above, but with the bias potential varied from 0 to 0.5 V at a rate of 1 mV/s. Expansions of the low current areas of both these graphs (so that the blue and black traces can be seen more clearly) are given in Figures S2 and S3.