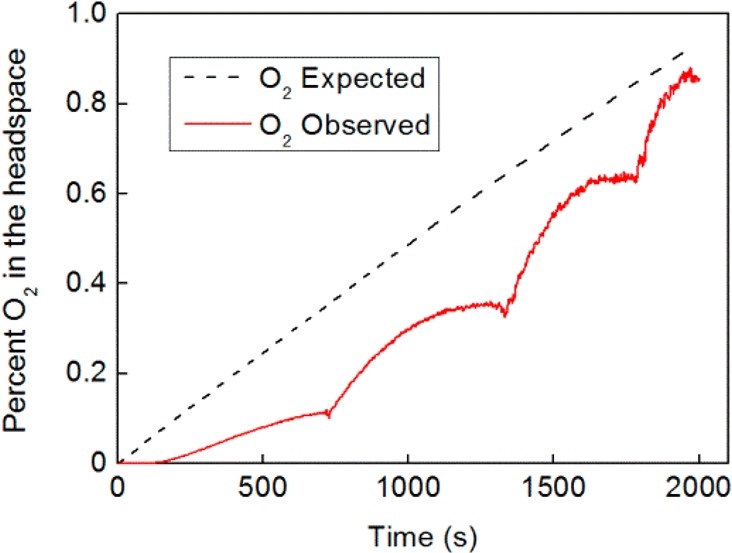
Figure 4.

Comparison of the amount of O2 expected in the cell headspace on the basis of the charge passed (black dashed line) and O2 detected in the cell headspace by fluorescence-quench measurements (red line). Bubbles collected on the anode and were periodically dislodged by shaking, accounting for the increments observed in the measured O2 signal.
