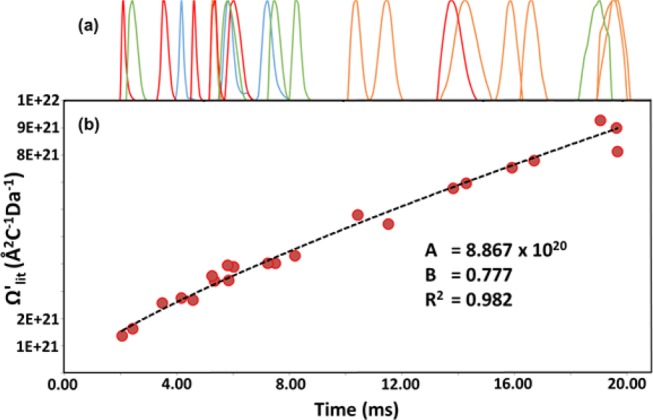
Figure 3.

(a) Arrival time distribution (ATD), showing clear peaks in normalized plots of raw drift time (tD) yielded by the POM calibration set (green = 1, red = 2, orange = 3, and blue = 4; intensities normalized; x-axis values are tD). (b) From these data, modified drift time values (tD′) are calculated and fit to DTCCSHe data using a y = AxB curve, using the approach and notation set out in ref (34).
