Figure 4.

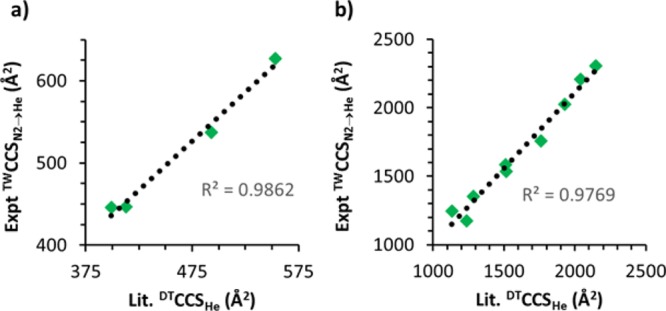
Correlation between previously published literature DTCCSHe values and experimentally determined TWCCSN2→He values for (a) decathymidine, gradient of the trend line = 1.19, and (b) cytochrome c, gradient of the trend line = 1.11.

Correlation between previously published literature DTCCSHe values and experimentally determined TWCCSN2→He values for (a) decathymidine, gradient of the trend line = 1.19, and (b) cytochrome c, gradient of the trend line = 1.11.