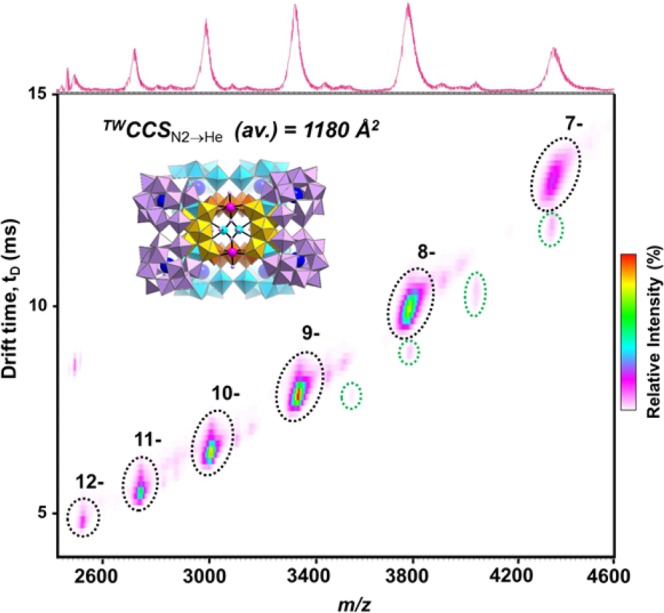
Figure 7.

IM-MS spectrum of structure B, where the major series of peaks corresponds to the core {Se2W29}4 cluster, and the minor/less-intense series (at shorter tD drift times, peaks highlighted in green) is assigned to the aggregation of two such clusters. The TWCCSN2→He value quoted is an average across many charge states of the dominant cluster (see Supporting Information for individual values).
