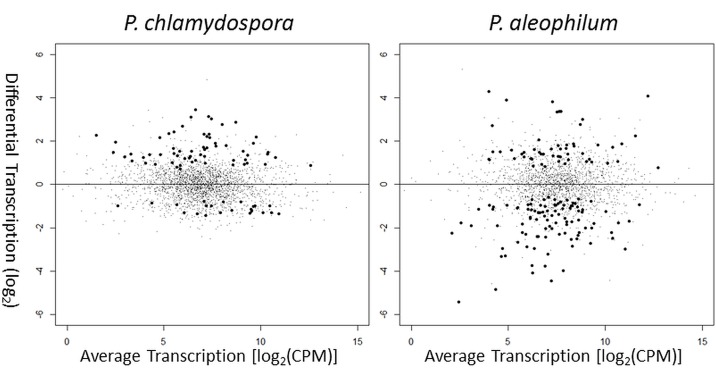
Fig 3. MA plot of transcriptomes.
Y-axis: Differential transcription level (log2) between samples with and without addition of V. vinifera callus culture for; left: P. chlamydospora; right: P. aleophilum. Positive values indicate increased transcription in the presence of callus culture, negative values indicate decreased transcription. X-axis: average transcription levels in CPM (counts per million library reads). Black spheres indicate genes with a non-differential transcription probability (H0) of p<0.01 a.k.a. differentially transcribed; black dots indicate non-differentially regulated genes (p≥0.01).

