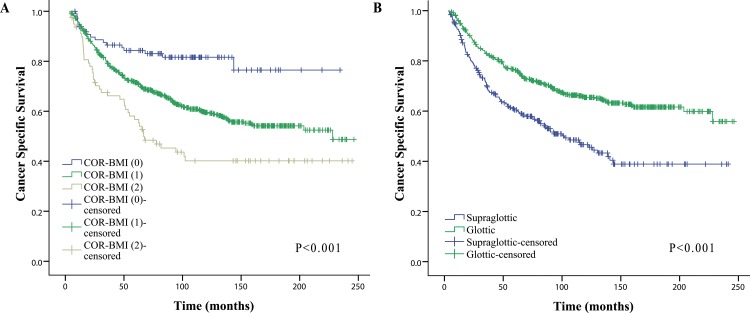
Fig 2. Kaplan-Meier curves for CSS rates of subgroups.
(A) Kaplan-Meier curves for CSS rates of LSCC patients categorized by COR-BMI score (0/1/2). (B) Kaplan-Meier curves for CSS rates of LSCC patients categorized by tumor subsite. Abbreviations: CSS = cancer-specific survival; LSCC = Laryngeal squamous cell carcinoma; COR-BMI = Combination of red blood cell distribution width and body mass index.

