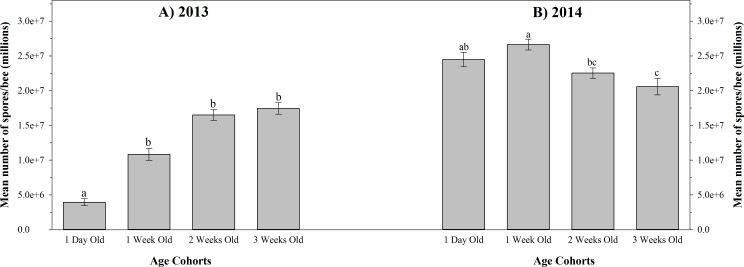
Fig 4. Nosema ceranae infection intensity in bees of four age cohorts within experimental nucleus colonies in 2013 and 2014.
Mean ± SE Nosema ceranae infection intensities within different age cohorts are shown for (A) all four 2013 quadruple-cohort colonies combined, and (B) all four 2014 quadruple-cohort colonies combined. Different letters indicate significant differences between age cohorts (P < 0.01) of the same year. Age labels indicate age at colony establishment; bees were two weeks older when analyzed.

