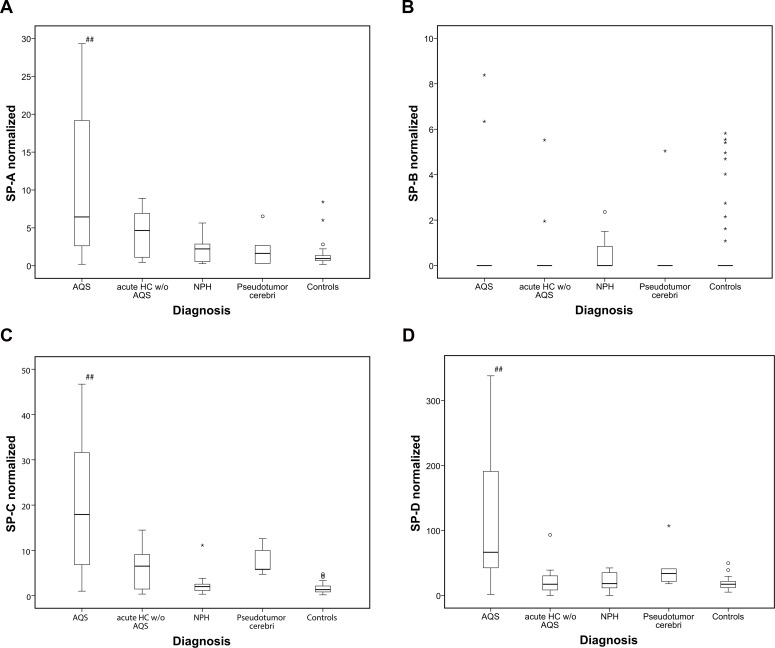
Fig 2.
a-d) CSF levels of SP A—D (ng/ml) in control group and hydrocephalus subgroups normalized to total CSF protein concentration of the patients. Significant elevation of SP levels was found for SP-A, C and D for AQS patients compared to control only. Other hydrocephalus entities showed trends towards elevation only.*: Data value lies >3 times of the interquartile range away from the mean value.°: Data value lies between 1.5 and 3x of the interquartile range away from the median value.

