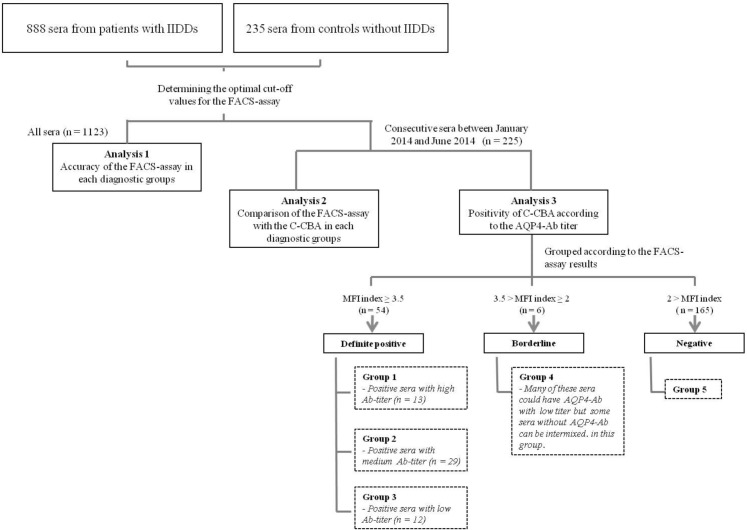
Fig 1. Flow chart illustrating the process of subject selection and analysis.
For the analysis of the accuracy of the FACS assay, all 1123 serum samples were used. To compare the accuracy of the FACS assay with the C-CBA kit, 225 serum samples (54 FACS-positive, 6 FACS-borderline, and 165 FACS-negative) were used. These 225 samples were further classified into groups 1–5 according to the MFIi of the FACS assay: Group 1 = AQP-4 Ab positive sera with high titer of MFIi (≥ 50), Group 2 = AQP-4 Ab positive sera with medium titer of MFIi (10 ≤ MFIi < 50), Group 3 = AQP-4 Ab positive sera with low titer of MFIi (3.5 ≤ MFIi < 10), Group 4 = sera with borderline MFIi (2 ≤ MFIi < 3.5), Group 5 = AQP-4 Ab negative sera (MFI < 2). MFIi values were considered to be significant only when the MFI ratio is ≥2). The researchers who performed the C-CBA were blind to the results of the FACS assay. Abbreviations: AQP4-Ab = aquaporin-4 antibody, C-CBA = commercial cell-based assay, FACS = fluorescence-activated cell sorting, FACS-positive = tested positive in the FACS assay, FACS-negative = tested negative in the FACS assay, FACS-borderline = tested borderline in the FACS assay, IIDD = idiopathic inflammatory demyelinating disease, MFIi = mean fluorescence intensity index.

