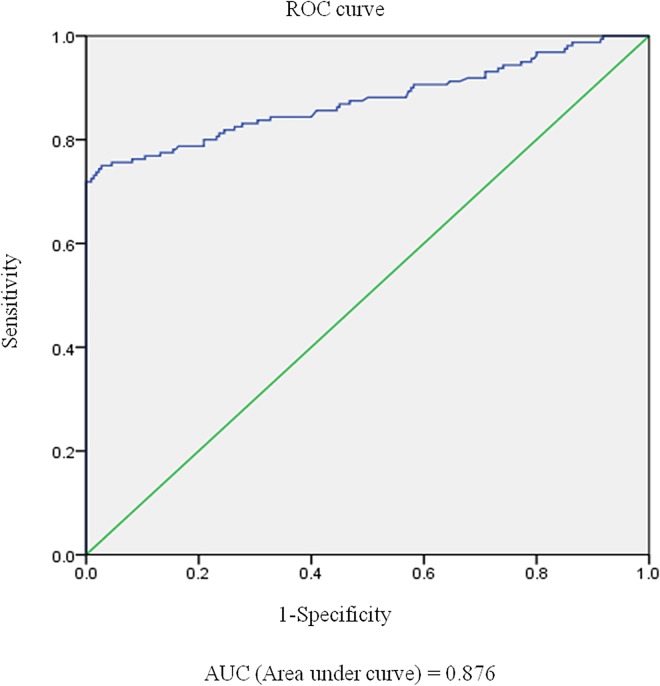
Fig 2. Results of the ROC analysis.
The ROC analysis showed that the MFIis for the FACS revealed an area under the curve of 0.876 when detecting sera from patients with definite NMO. Abbreviations: FACS = fluorescence-activated cell sorting, MFIi = mean fluorescence intensity index, NMO = neuromyelitis optica, ROC = receiver operating characteristic.

