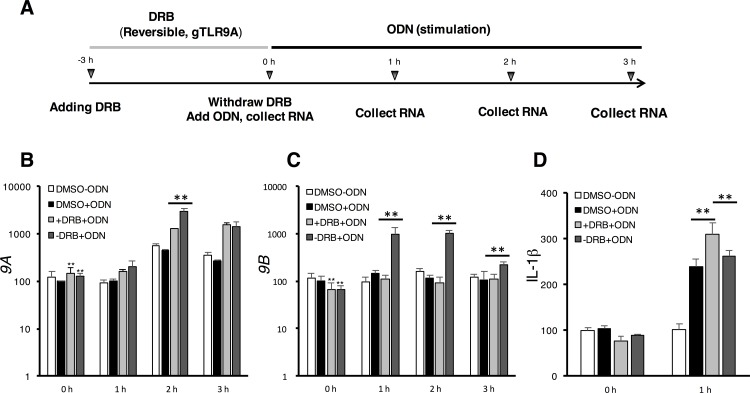
Fig 5. Self-limiting of the gTLR9 signaling by gTlr9 alternative splicing.
(A) Experiment design (see text for detailed description) (B-C) +DRB+ODN indicates that DRB was left in the culture medium throughout the course of ODN stimulation. In contrast,–DRB+ODN represents that DRB was withdrawn prior to ODN stimulation. Relative expression of 9A and 9B normalized to ß-actin was determined. DRB pre-treatment (0 h) led to slight increase of 9A (B) and decrease of 9B (C) (Cf. the two gray bars vs. white and black bars). Subsequent stimulation by ODN resulted in strong elevation of 9B (1–3 h, dark gray bars) (C). (D) IL-1ß protein expression. The expression of IL-1ß in the DMSO group at 0 h was set as 100%. The expression pattern of IL-1ß at 1 h roughly correlated with the expression of 9A and 9B, where 9A expression favored and 9B expression suppressed IL-1ß production. Results are presented as the mean ± SD (n = 3). Student’s t-test, 0.01< p < 0.05 (*) and p < 0.01 (**).

