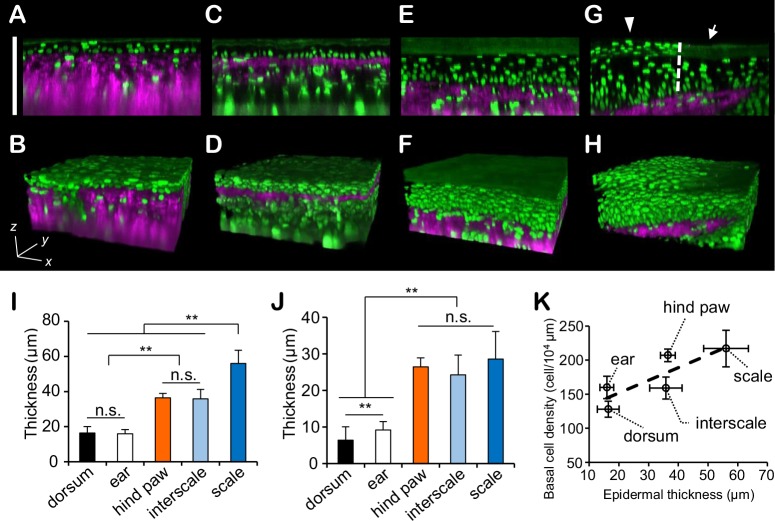
Fig 3. Comparison of the epidermal structures.
(A-H) Orthogonal images and reconstructed three-dimensional images of the following skin areas: dorsum (A, B), ear (C, D), hind paw (E, F), and tail (G, H). Scale bar = 100 μm. The arrow and arrowhead show the interscale and scale, respectively. (I, J) The average epidermal thickness without the cornified layer (I) and the thickness of the cornified layer (J). These data were obtained from 21 (dorsum), 15 (ear), 15 (hind paw), 14 (interscale), and 14 (scale) points across 5–7 mice per group and compared using the Steel-Dwass test. The error bars represent the standard deviations **P < 0.01; n.s., not significant. See also S3 and S4 Tables. (K) The relationship between the basal cell density and epidermal thickness (I). The correlation coefficient was 0.837. The dashed line is the regression line. The error bars represent the standard deviations. The statistical significance of the differences in the basal cell densities between the body regions was shown in S5 Table.

