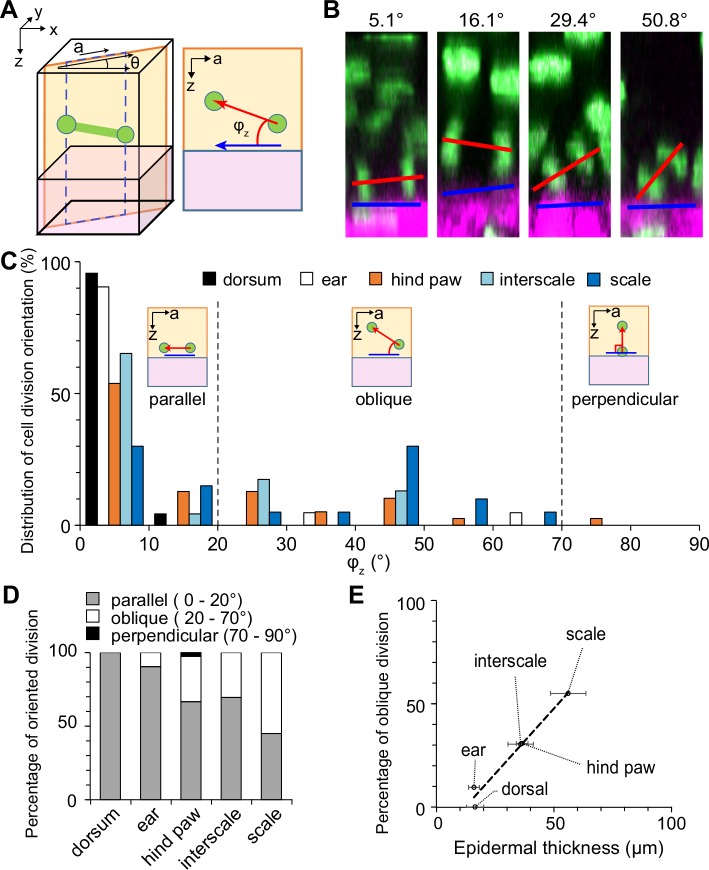
Fig 6. Analysis of cell division orientations relative to basement membrane.
(A) Schematic of the cell division orientation measurements. The direction “a” is defined as the lateral (on the x-y plane) component of the cell division orientation. The angle was measured in the a-z plane. (B) Examples in the hind paw. (C) Histogram of the cell division orientations obtained from 23 (dorsum), 21 (ear), 39 (hind paw), 23 (interscale), and 20 (scale) divided cells. (D) The percentage of parallel (φz ≤ 20°), oblique (20° < φz ≤ 70°) or perpendicular (70° < φz ≤ 90°) divisions in C. (E) Relationship between epidermal thickness (Fig 3I) and the percentage of oblique divisions (D). The correlation coefficient was 0.986. The dashed line is the regression line. The error bars represent the standard deviations.

