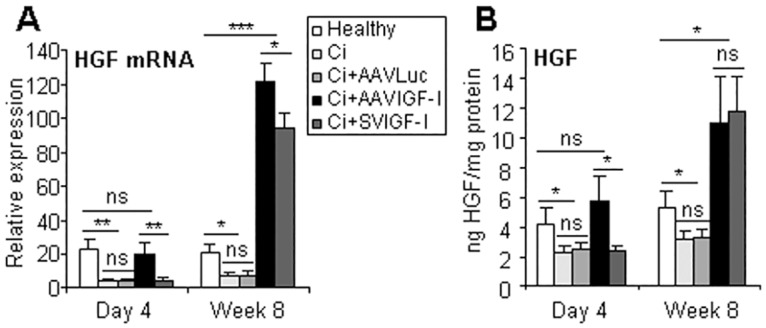
Fig 4. Analysis of HGF.

Animals were treated as described in Fig 1 and HGF mRNA (a) and protein (b) levels were evaluated by qRT-PCR or ELISA in liver extracts. Transcript levels shown are relative to GAPDH mRNA levels. Error bars denote standard deviations. Significant and non-significant (ns) differences are highlighted.
