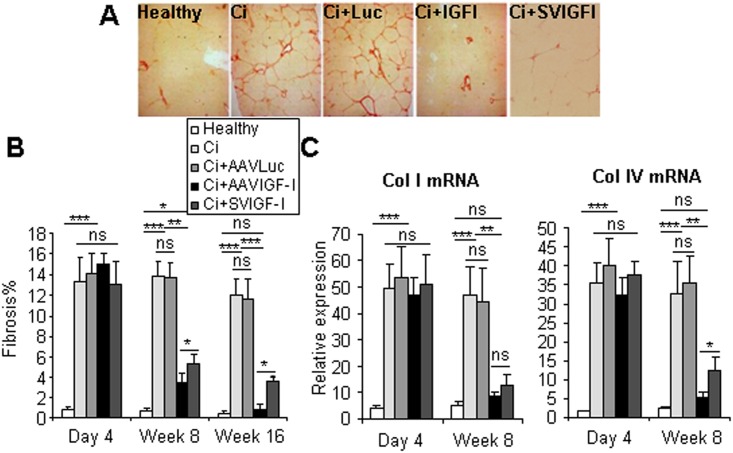
Fig 6. Analysis of liver fibrosis.
Animals were treated as described in Fig 1 and liver fibrosis was evaluated by quantification (b) of Sirius red staining 16 weeks after vector administration (a) or by qRT-PCR of collagen I and collagen IV mRNA performed in samples collected at the indicated times (c). Collagen mRNA levels shown are relative to GAPDH mRNA levels. Error bars denote standard deviations. Significant and non-significant (ns) differences are highlighted.

