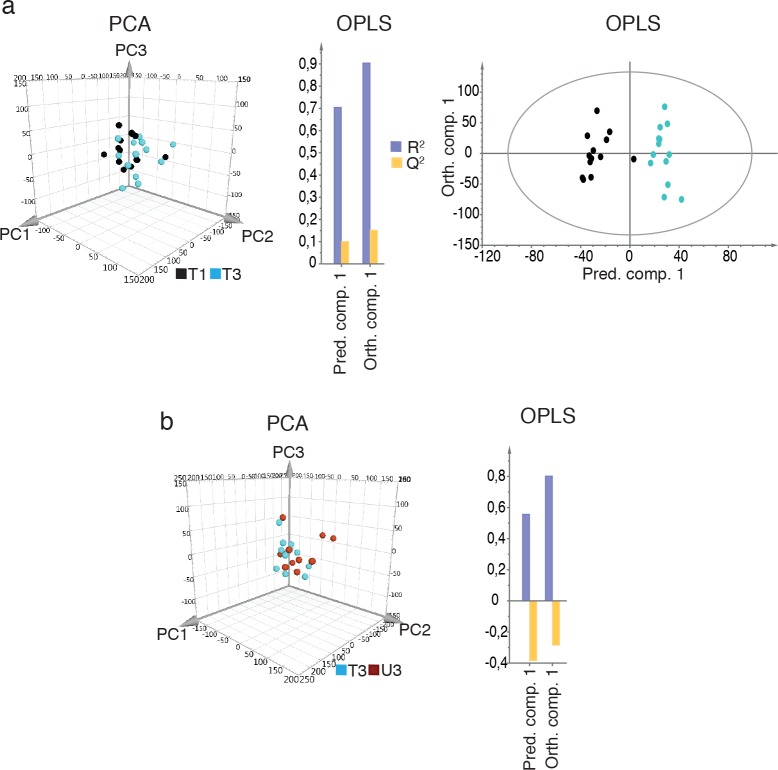
Fig 5. Endurance-induced skeletal muscle memory at the transcriptome level.
Human skeletal muscle gene expression data (12,848 genes) was used to study: a) The presence of any residual effect in the previously trained leg by comparing before training in Period 1 (T1, black) with the same leg before Period 2 (T3, blue). Left: results are presented as a 3D PCA score plot showing the PC1-3 plane. Middle: summary of fit of OPLS; R2 (grey): goodness of fit of the model, which represents the cumulative explained variance; Q2 (yellow): goodness of prediction of the model, which represents the cumulative fraction of the total variance that can be predicted by the model from cross-validation. Right: 2D score plot of OPLS (n = 13) b) Transcriptome differences between the previously trained leg (T3, blue) and the previously untrained leg (U3, brown) before Period 2. Left: a 3D PCA score plot showing the PC1-3 plane. Right: summary of fit of OPLS; R2 and Q2 as described above (n = 12). For PCA and OPLS quality parameters, refer to Tables 1 and 2, respectively.

