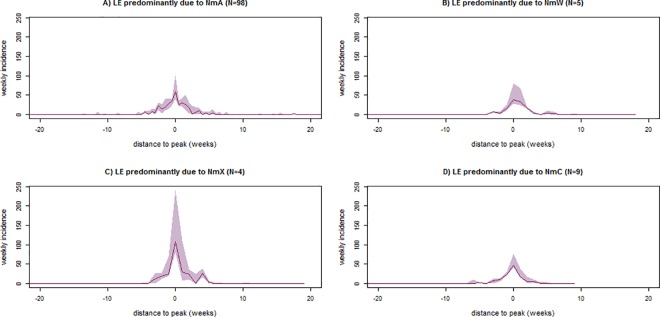
Fig 3. Epidemic curves (weekly incidence rates per 100,000) of suspected meningitis cases in health areas with localized epidemics (LE), by epidemic serogroups, in Tahoua, Tillabery and Dosso regions, Niger, 2002–2012 and 2014–2015.
The localized epidemics were defined with the threshold of 20 cases per 100,000 inhabitants during at least two consecutive weeks (LE20). The solid line represents the median, and the shaded area represents the 25th and 75th percentiles of the weekly incidences. Epidemic agents were defined according to the majority of pathogens identified by systematic polymerase chain reaction testing on cerebrospinal fluid.

