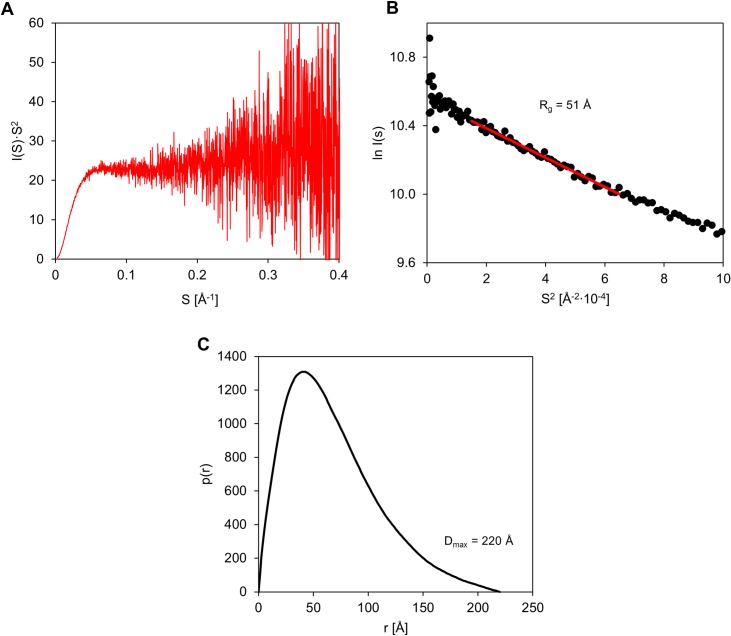
Fig 5. SAXS characteristics of MetC.
(A) Kratky plot analysis. The intensity of scattering is plotted as I(s)·s2 versus s. The plot has no maximum, and at higher s values, it plateaus. (B) Gunier plot of SAXS data. The experimental points exhibit good fit to Gunier equation, which indicates also good monodispersity of the MetC in solution. (C) The pair distribution function p(r) of MetC. The asymmetric shape of the function indicates an elongated protein shape.

