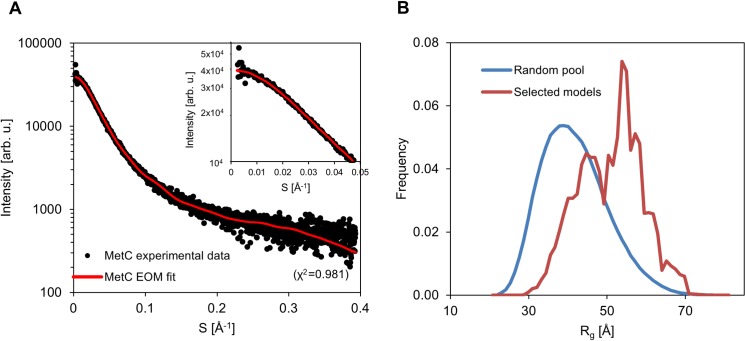
Fig 6. Modelling of MetC low resolution structure in solution.
(A) The fit between the experimental scattering profile (black dots) and the profile back-calculated from the selected sub-ensemble (generated with EOM) (red) indicates a good match (χ2 = 0.981), inset–the zoom of low-s region. (B) Radii of gyration profile of the initial random pool of MetC structures (blue) and profile of the final conformational sub-ensemble (red).

