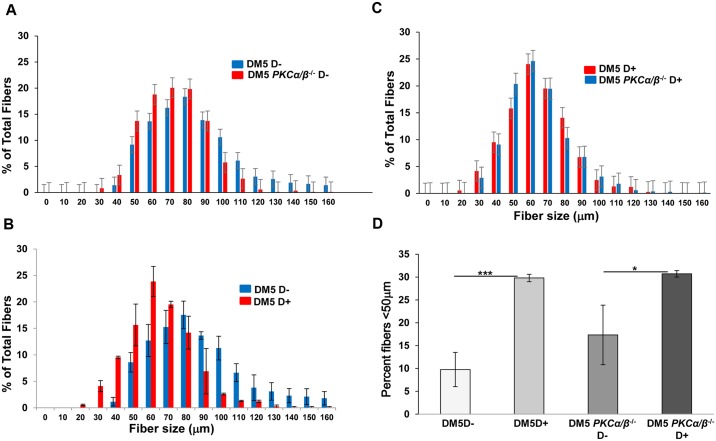
Fig 5. PKCα/β deficiency does not affect skeletal muscle fiber size distribution in the RNA toxicity mice.
(A) Histogram of skeletal muscle fiber diameter sizing shows that PKCα/β deficiency in the absence of RNA toxicity mice (DM5/PKCαβ-/- D- (n = 3)) (red) results in a distribution similar to that seen in uninduced mice (DM5/PKCαβ+/+ D- (n = 3)) (blue). (B) Histogram of skeletal muscle fiber diameter distribution shows that smaller fibers in the RNA toxicity mice (DM5 D+ (n = 3)) (red) as compared to uninduced mice (DM5 D- (n = 3)) (blue). (C) Histogram of skeletal muscle fiber diameter sizing shows that no differences in fiber size distribution after PKCα/β deficiency (blue) in the presence of RNA toxicity (red). (D) The graph showing no differences in the percentage of fibers less than 50μm in the PKCα/β deficiency mice as compared to normal mice in the presence of RNA toxicity. Note the increased percentage fibers in the presence of toxic RNA as compared to uninduced mice. At least 300 fibers were analyzed per mouse. *p = 0.05, and ***p = 0.001, Student’s t test; error bars are mean±stdev.

