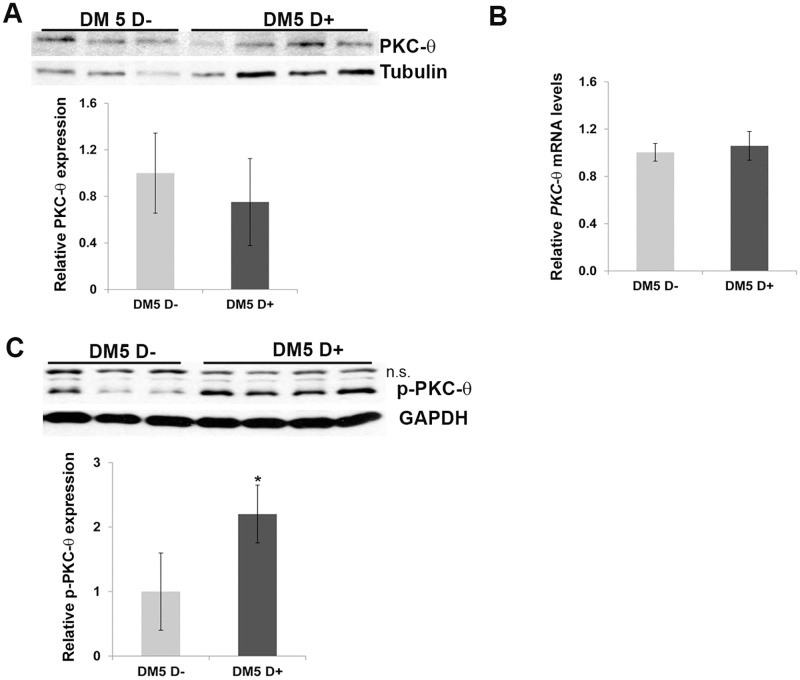
Fig 6. Phospho-PKCθ levels are increased in the RNA toxicity mice.
(A, B) Western blot and quantitative RT-PCR shows no significant differences in PKCθ expression in uninduced and induced skeletal muscle tissues from RNA toxicity mice (n = 3–5 for uninduced and n = 3–5 for induced mice). Tubulin-loading control. (C) Western blot of skeletal muscle protein extracts shows increased levels of p-PKCθ in DM5 mice with RNA toxicity. n.s. indicates non-specific band; GAPDH-loading control. *p = 0.05, Student’s t test; error bars are mean±stdev.

