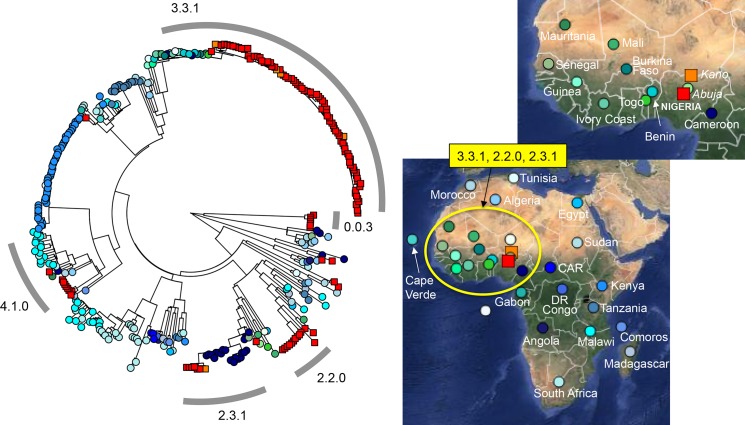
Fig 1. Distribution of Nigerian S. Typhi isolates in Africa in this study.
A maximum likelihood tree of 366 S. Typhi isolates constructed using 9,352 SNPs from whole genome sequence from 128 Nigerian isolates and 238 isolates from other regions of Africa is shown on the left. The geographical location of isolation is highlighted on the maps of Africa displayed on the right (http://microreact.org/showcase/). S. Typhi isolates from Abuja (122 isolates) and Kano (6) are denoted using red and orange squares, respectively. Colored circles on both the tree and maps represent isolates from other regions of Africa. The common genotypes of the Nigerian isolate are highlighted by a grey ring surrounding the tree with the corresponding geographical location marked on the map. Branch lengths are indicative of the estimated substitution rate per variable site.

