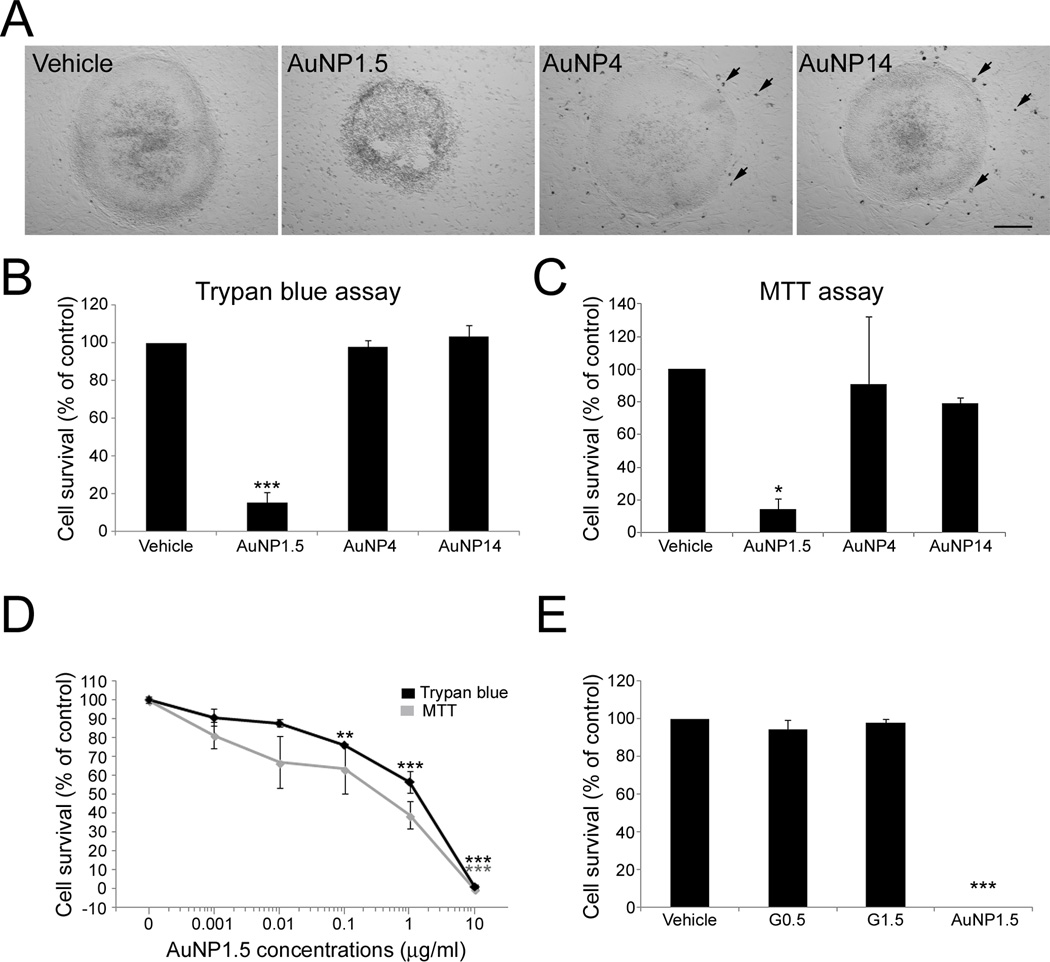
Figure 2.
Exposure of hESCs to AuNPs. (A) WA09 hESC cell colonies on MEF feeder layer following 24 h exposure to vehicle, or 10 µg/mL of AuNP1.5, AuNP4, and AuNP14. Only colonies exposed to AuNP1.5 exhibited altered morphology suggestive of cell death. Arrows indicate MEFs with visible intracellular uptake of AuNPs in the case of AuNP4 and AuNP14. AuNP1.5 was too small to be seen. The scale bar is 160 µm in the bright field microscopic images. (B) Cell viability analysis of hESCs exposed for 24 h to 10 µg/mL of the different sized AuNPs using Trypan blue assay. The percentage of viable cells [(total number of cells - number of non-viable dark-blue stained cells) / (total number of cells) ×100] was significantly decreased following exposure to AuNP1.5. Histogram values are means ± SEM. Statistical significance compared to the vehicle control group is designated as (***) (p < 0.001; n = 3, one-way ANOVA). (C) Measurement of mitochondrial activity in hESCs exposed for 24 h to 10 µg/mL of the different sized AuNPs by the MTT assay. A decrease in mitochondrial enzymatic activity was observed between the vehicle and the AuNP1.5 experimental groups. Histogram values are means ± SEM. Statistical significance compared to the vehicle control group is designated as (*) (p = 0.028; n = 3, one-way ANOVA). (D) Dose-response curves for the survival of hESCs exposed to AuNP1.5 for 4 days using Trypan blue and MTT assays. Statistical significances compared to the vehicle group are noted as (***) (p < 0.001; n = 3) and as (**) (p < 0.01; n = 3). (E) Cell viability analysis of hESCs exposed for 24 h to 10 µg/mL of AuNP1.5 and dendrimers G0.5 and G1.5 using Trypan blue assay. Histogram values are means ± SEM. Statistical significance compared to the vehicle control group is designated as (***) (p < 0.001; n = 3, one-way ANOVA).

