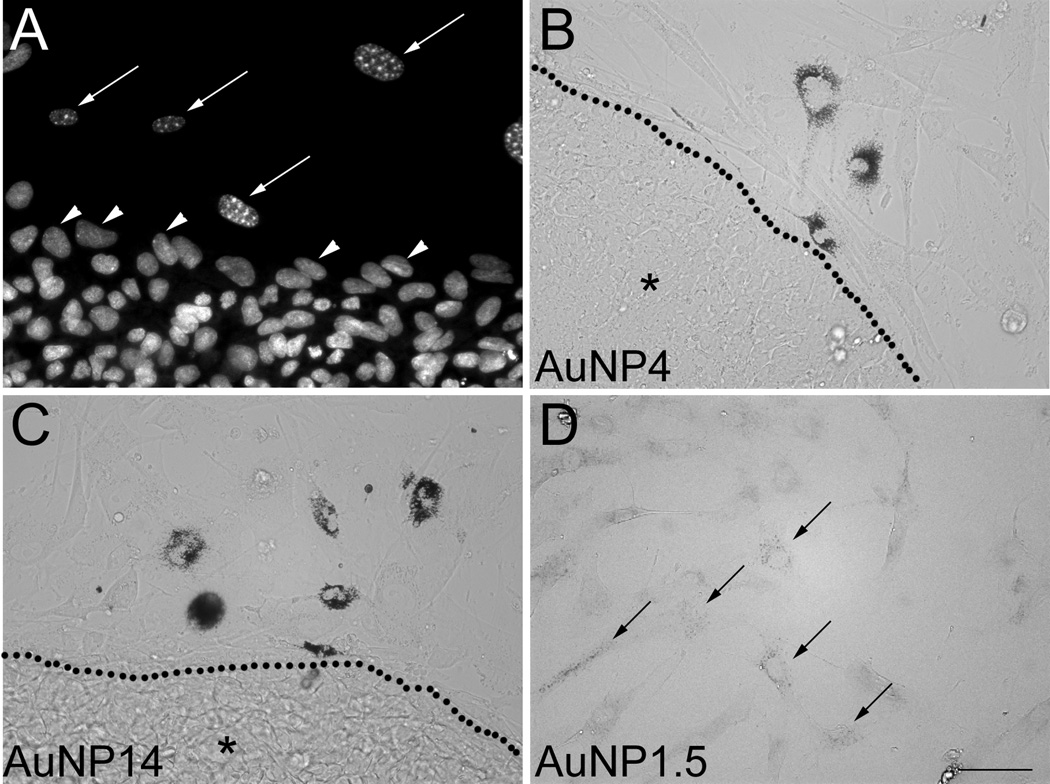
Figure 3.
Uptake of AuNPs by MEFs but not hESCs. (A) Cell cultures stained with the nuclear marker DAPI showing the bright heterochromatin foci characteristic of MEFs (long arrows), which allow to distinguish them from hESCs (arrowheads). (B, C) Uptake of AuNP4 (B) and AuNP14 (C) was clearly visible in MEFs, but not in hESC colonies (region marked by *) delineated by dotted lines. (D) Uptake of AuNP1.5 by MEFs was only visible following intensification with GoldEnhance™ (arrows). The scale bar length in (D) valid for (A–C) is 50 µm.

