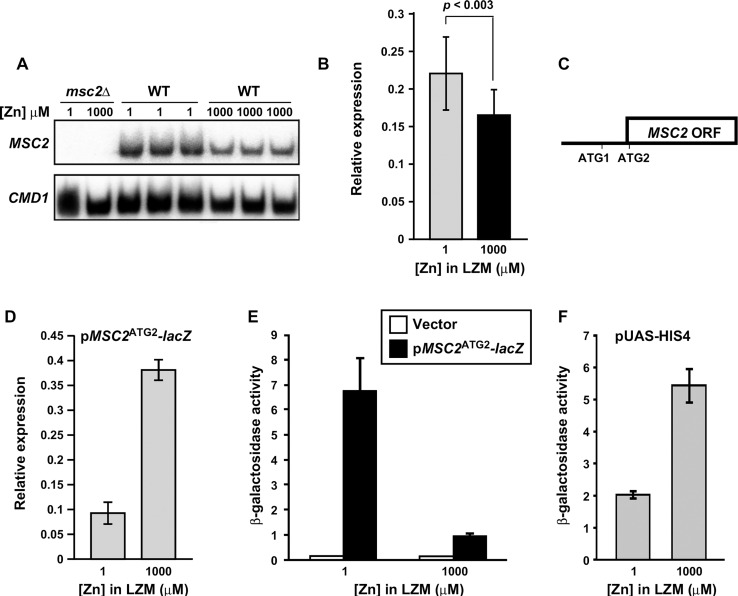
Fig 1. Effects of zinc status on chromosomal MSC2 and plasmid MSC2ATG2-lacZ expression.
A) MSC2 mRNA levels were measured by S1 nuclease protection assay of RNA isolated from msc2Δ mutant (DY150 msc2Δ) and wild-type (DY150) cells grown under zinc-limiting (LZM + 1 μM ZnCl2) or replete (LZM + 1000 μM ZnCl2) conditions. CMD1 was used as a loading control. B) The mRNA abundance of MSC2 in zinc-limited and replete DY150 cells was also determined by quantitative RT-PCR. MSC2 abundance was normalized to the average abundance of three control transcripts (18S rRNA, TAF10, and ACT1). The data plotted represent the means of fifteen replicates from each condition and the error bars denote ± 1 S.D (p <0.003 as determined by the Student’s paired t-test). C) Diagram of MSC2 with two in-frame ATGs at the 5’ end of the open reading frame indicated. ATG2 is the predicted translation start site, ATG1 is located 48 nucleotides upstream of ATG2, and the next in-frame ATG (ATG3) in the ORF is ~700 bp downstream of ATG2. Several out-of-frame ATGs are found in the interval ATG2 and ATG3. D) lacZ mRNA levels were measured by quantitative RT-PCR using RNA isolated from wild-type (DY150) cells transformed with the MSC2ATG2-lacZ reporter and grown in LZM supplemented with the indicated concentration of ZnCl2 as in panel B. The data plotted represent the means of three replicates from each condition and the error bars denote ± 1 S.D. Panels E, F) β-galactosidase activity was measured in wild-type (DY150) cells bearing the lacZ vector (YEp353), the MSC2ATG2-lacZ reporter, or a HIS4-lacZ fusion (pUAS-HIS4) grown under zinc-limiting (LZM + 1 μM ZnCl2) or replete (LZM + 1000 μM ZnCl2) conditions. Results are the means ± S.D. for three independent cultures for each condition and are representative of two independent experiments.

