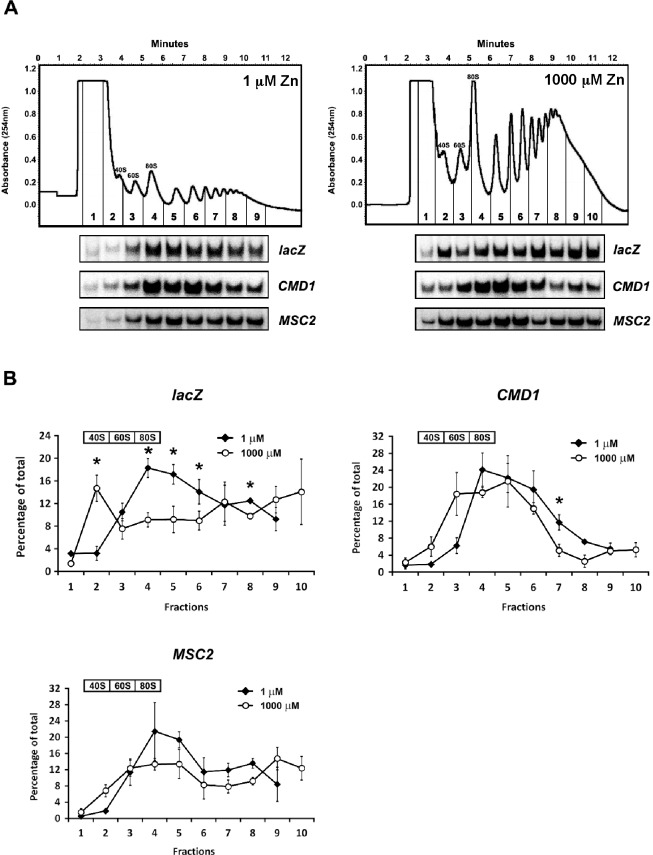
Fig 3. Polysome profile analysis of MSC2ATG2-lacZ mRNA.
A) Representative polysome profiles of wild-type (DY150) cells expressing the MSC2ATG2-lacZ reporter and grown under zinc-limiting (LZM + 1 μM ZnCl2) or replete (LZM + 1000 μM ZnCl2) conditions. The positions of the 40S, 60S, 80S peaks are indicated and the collected fractions are numbered. RNA was extracted from each fraction and S1 nuclease protection assays were performed to detect lacZ, CMD1, and chromosomal MSC2 mRNA. B) Quantified lacZ, CMD1, and MSC2 mRNA abundance were plotted as the percentage of their total amount in all fractions. Results are the means ± S.D. for three independent cultures for each condition. The fractions containing the 40S, 60S, and 80S peaks are indicated and the asterisks indicate significant differences (p < 0.05) between zinc-replete and zinc-limited samples as determined by the paired Student’s t-test.

