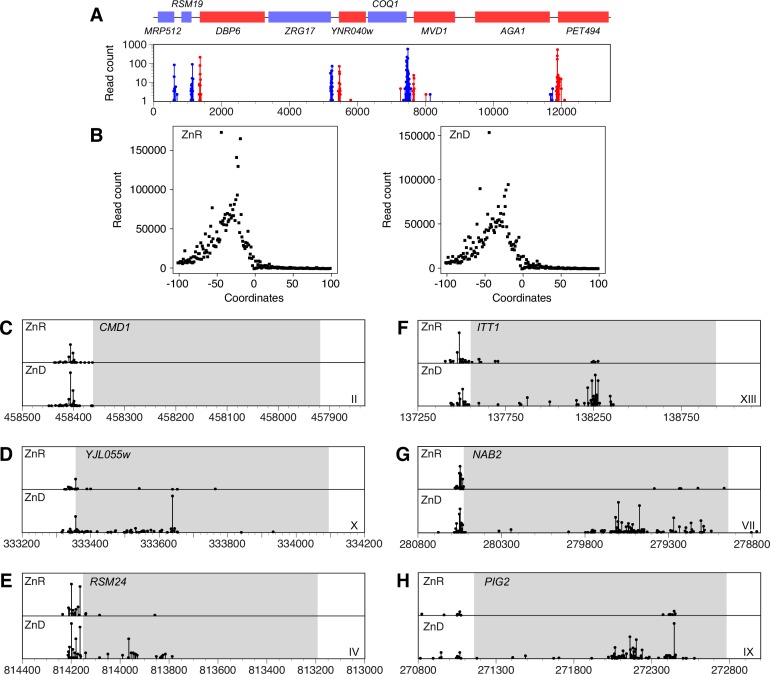
Fig 8. Mapping transcription start sites by 5’ Deep-RACE.
A) Transcription start sites mapped for an ~13 kb region of yeast chromosome XIV is shown. Genes indicated in red are transcribed from left to right while those in blue are transcribed from right to left. Independent sequencing reads, representing mRNA 5’ ends, are plotted with the same color scheme across the region. B) The transcription start sites mapped for all genes are plotted relative to the translation initiation codon of the open reading frame numbered as +1. Data obtained from zinc-replete and zinc-limited cells are plotted. C-H) Transcription start sites for the indicated genes are plotted relative to the open reading frame shown in gray. The chromosome of each gene is indicated by the Roman numeral and the coordinates represent the location on the corresponding chromosomes.

