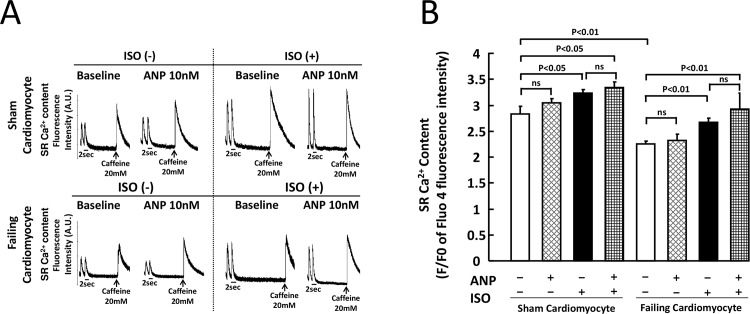
Fig 4. SR Ca2+ content in sham and failing cardiomyocytes.
A. Measurement of SR Ca2+ content by caffeine application. After isolation of cardiomyocytes, cardiomyocytes were loaded with 20 μM Fluo-4 AM (Molecular Probes) for 30 min at room temperature in the dark. Then, these cardiomyocytes were washed with Tyrode solution containing final concentration of 2 mM Ca2+. The cardiomyocytes were electrically stimulated by a field stimulator (IonOptix, MA) at a frequency of 0.5 Hz for 30 sec, and then final concentration of 20 mM caffeine were added. An arrow shows a point of addition of caffeine to the dish. B. Bar graph representation of the data in Fig 4A. Each group included 20–30 cells. At least 4 cells were evaluated for each preparation. The bars indicate the means ± SE.

