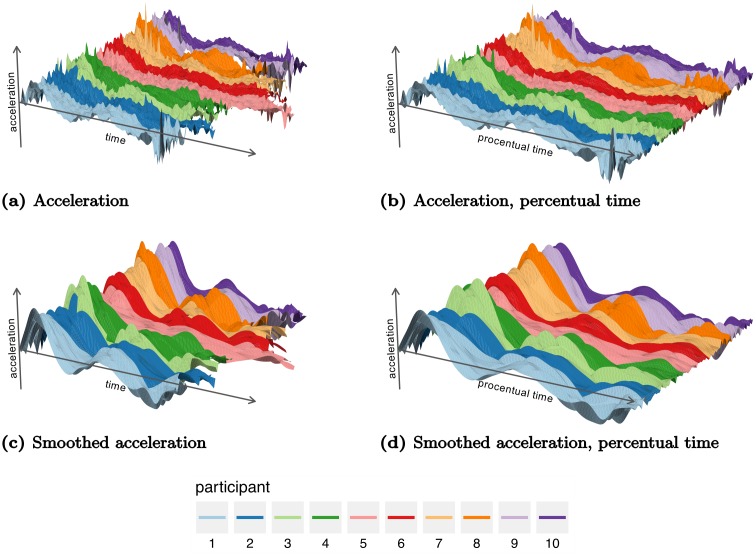
Fig 3. Surface plots of acceleration profiles ordered by repetition (y-axis) in the experiment with d = 30, T.
The figures display (a) raw acceleration in recorded time, (b) raw acceleration in percentual time, (c) smoothed acceleration in recorded time, and (d) smoothed acceleration in percentual time. The plots allow visualization of the variation across participants and repetitions.

