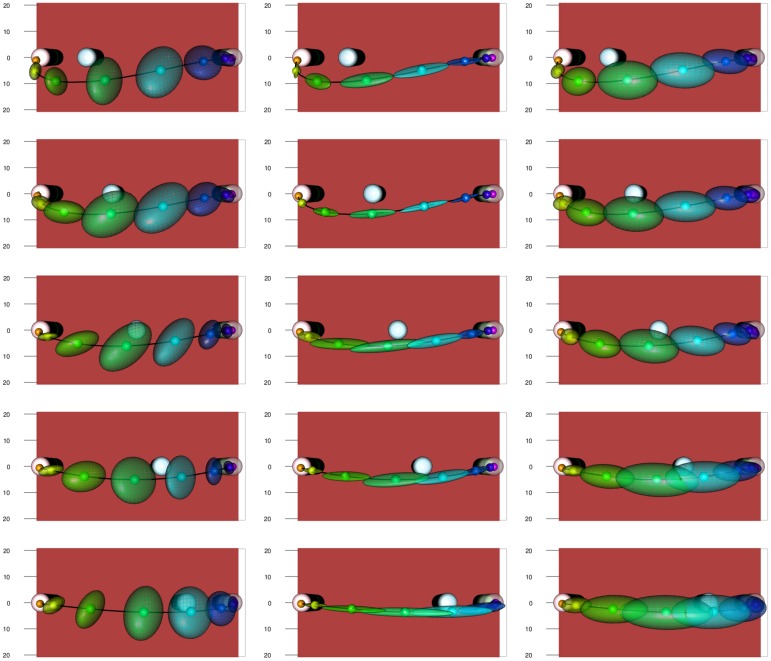
Fig 12. Top-view of the experimental setup from the top for the medium height obstacle at all obstacle distances with the mean trajectory plotted.
Along the trajectory eight equidistant points (in percentual warped time) are marked, and at each point 95% prediction ellipsoids are drawn. The ordering is the same as in Fig 11.

