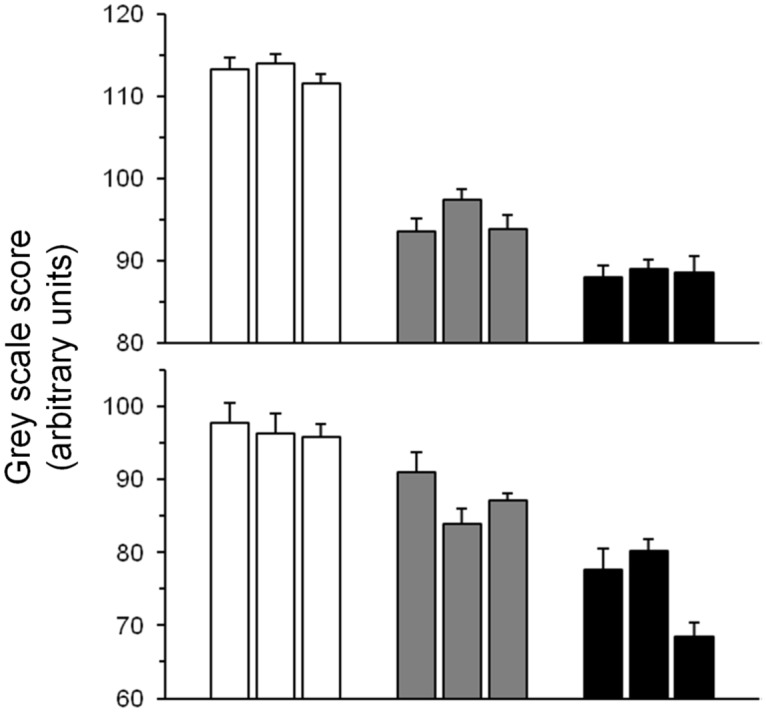
Fig 2. Pigmentation status (as gray scale score) in pigmentation-selected populations after 40 generations of artificial selection.

Higher gray scores indicate lighter pigmentation. Upper panel, females; lower panel, males. Open bars, LPIG; gray bars, CPIG; black bars, DPIG. Data are means (±SE). For both sexes, Tukey post-hoc tests revealed significant differences for all pairwise comparisons (P<0.0005): LPIG > CPIG > DPIG. For each sex, n = 9–10 per replicate population.
