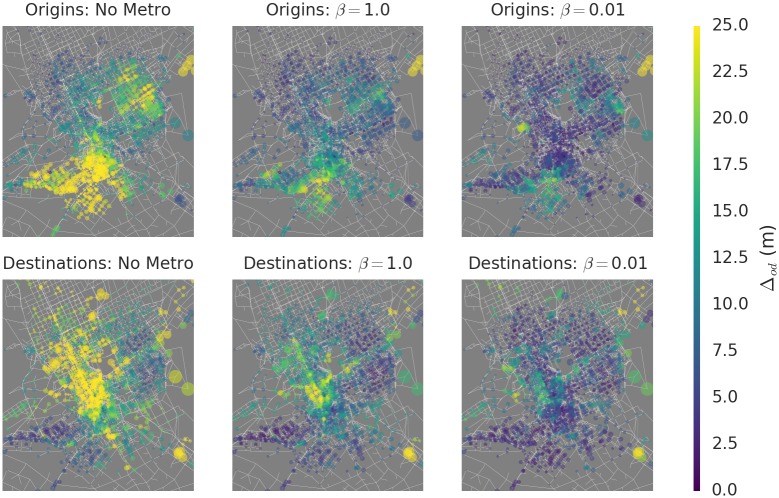
Fig 4. Spatial heterogeneity in contributions to global congestion.
The congestion impact Δod is aggregated over o (top) and d (bottom). The aggregates Δo and Δd can be interpreted as the expected impact of removing one driver who lives (resp. works) at a location from the streets, without knowing the details of their route. Importantly, Δod is highly unevenly distributed throughout the city, indicating opportunities to prioritize those who live in the southwest and northeast, and those who work downtown. The heterogeneity is reduced by faster metro speeds, but does not vanish, and even increases in the limiting case of very low β. Maps produced with Python’s networkx package [32] v. 1.10, using road network data provided by the Arriyadh Development Authority (ADA).

