
Figure 3.
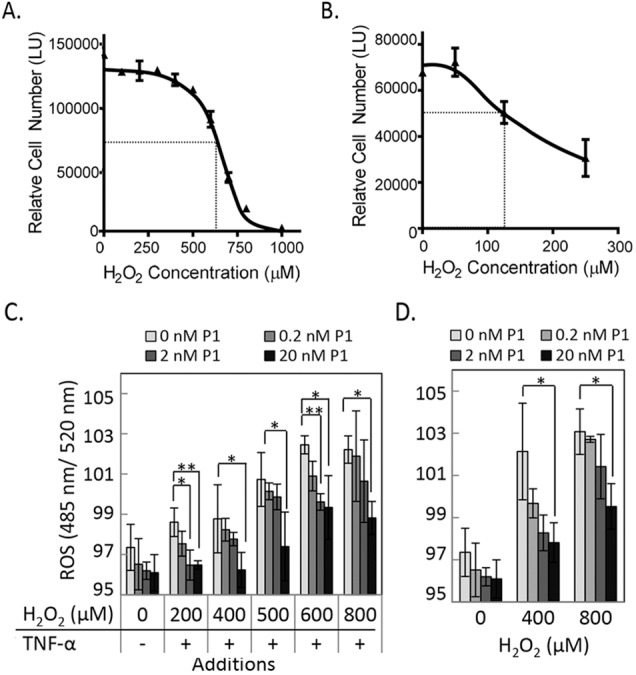
Cell viability and reactive oxygen species (ROS) levels with increasing oxidative stress. (A) ARPE-19 cells were treated with increasing concentrations of H2O2 in the presence of 10 ng/mL TNF-α for 16 hours. Relative cell numbers were determined at the end point using intracellular ATP as a live cell biomarker. A plot of relative cell numbers as a function of concentration was obtained using GraphPad Prism (La Jolla, CA, USA). Each point is the average of values from duplicate wells ± SD. The calculated half-maximal cell death occurred at 650 μM. (B) Oxidative stress treatment with increasing concentrations of H2O2 in the presence of 10 ng/mL TNF-α in pig RPE culture. Relative cell numbers were determined as in (A). The calculated half-maximal cell death occurred at 125 μM. (C) ARPE-19 cells were treated with increasing concentrations of H2O2 and 10 ng/mL TNF-α in the presence of indicated concentration of peptide P1 followed by ROS measurement. CellRox Green reagent was added 30 minutes before the end point. The fluorescence intensity (ex. 485 nm and em. 520 nm) for each condition was measured and plotted as a function of concentration. Each point is the average of triplicate wells ± SD. (D) ROS measurement of ARPE-19 cells treated as in (C) but in the absence of TNF-α. Each point is the average of triplicate wells ± SD. *P ≤ 0.05; **P ≤ 0.005. Each experiment was performed twice.