
Figure 5.
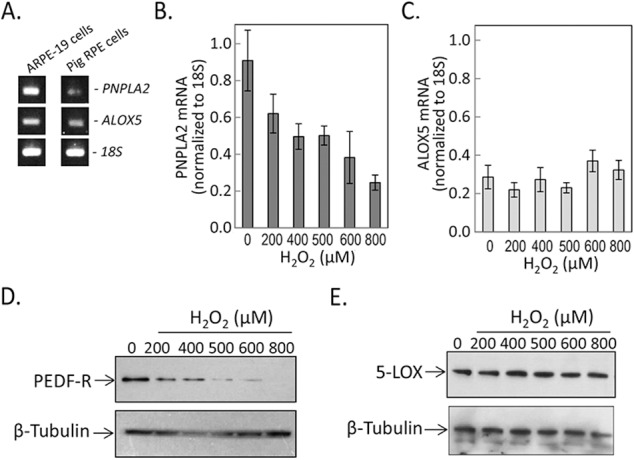
Levels of PNPLA2 and ALOX5 under oxidative stress. (A) Reverse transcription–PCR on mRNA from ARPE-19 and pig RPE with specific primers to PNPLA2 and ALOX5. Primers for 18S were used as internal control. PCR products were resolved by agarose gel electrophoresis and visualized with ethidium bromide under ultraviolet light. (B, C) Semiquantitative real-time reverse transcription–PCR to measure mRNA levels of PNPLA2 and ALOX5 in human ARPE-19 cells treated with increasing concentrations of H2O2 plus 10 ng/mL TNF-α for 8 hours. Values relative to 18S mRNA levels are shown on the y-axis. Each condition was tested in duplicate wells per experiment ± SD (error bars). (D, E) Total cell lysates from cells treated with indicated concentrations of H2O2 plus 10 ng/mL TNF-α for 8 hours. Samples were resolved by SDS-PAGE followed by immunoblotting with anti-PEDF-R (D) and anti-5-LOX (E). Both blots were stripped and immunoblotted with antibody to β-tubulin (loading control). Samples from duplicate wells were tested in each experiment. Each experiment was performed at least twice.