Figure 2.
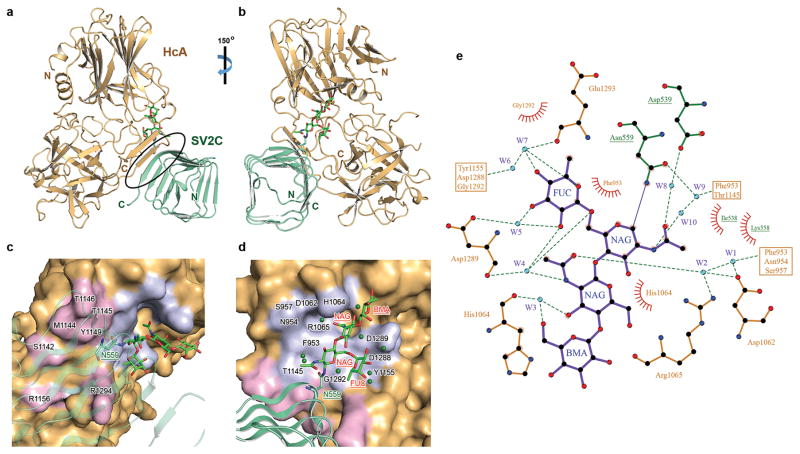
Structure of HCA in complex with human gSV2C. (a) Cartoon representation of the complex whereas HCA is gold and gSV2C is green. The black oval highlights the interacting β-strands between them. gSV2C-N559 and the attached N-linked glycan are shown in stick models. (b) A ~150° rotation of the complex about a vertical axis. (c,d) Close-up views of the protein–protein and protein–glycan association interfaces between HCA and gSV2C. HCA is in surface representation (gold), whereas HCA residues that directly interact with the peptide moiety of gSV2C or the N559 glycan are colored purple and light blue, respectively. Well-defined water molecules that mediate HCA–glycan binding are shown as green spheres. (e) Extensive interactions between gSV2C-N559 glycan and HCA. The plots were generated using LIGPLOT 36. HCA and gSV2C residues are labeled brown and green, respectively. Hydrogen bonds are indicated by dashed green lines. Key hydrogen bonding distances are listed in Supplementary Table 1. Residues involved in hydrophobic interactions are represented by an arc with spokes radiating towards the binding partners they contact.

