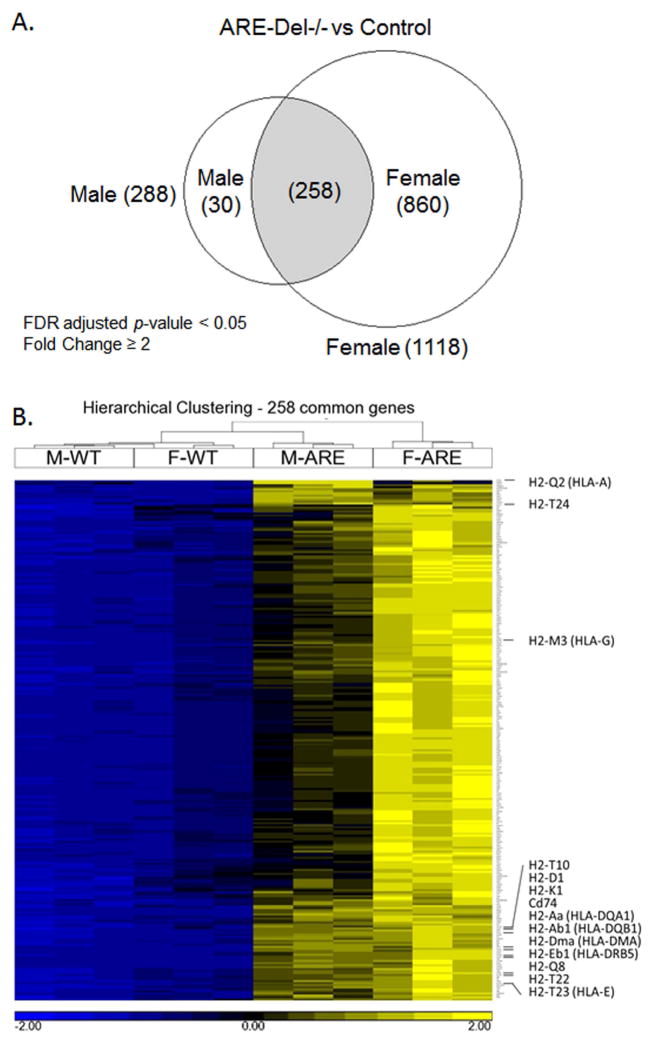
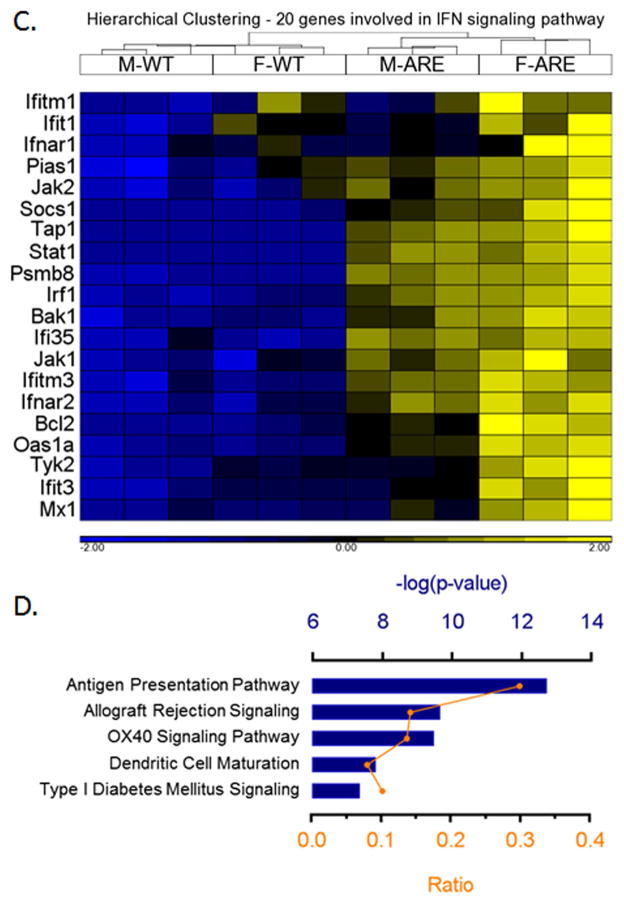
Figure 5.
Hepatic gene expression in male and female ARE-Del−/− mice at age 20 wks. 5A. Venn diagram of differentially expressed genes in male and female ARE-Del−/− mice vs control mice (n=3). 5B. Hierarchical clustering of 258 common genes. The human homologs are described in parentheses. 5C. Hierarchical clustering of 20 genes involved in interferon signaling pathway. 5D. Top canonical pathways of common genes derived from IPA. Ratio (bottom y-axis, yellow line) refers to the number of genes from dataset divided by the total number of genes that make up that pathway from within the IPA knowledgebase and the -log of P value (top y-axis, bar) was calculated by Fisher’s exact test.


