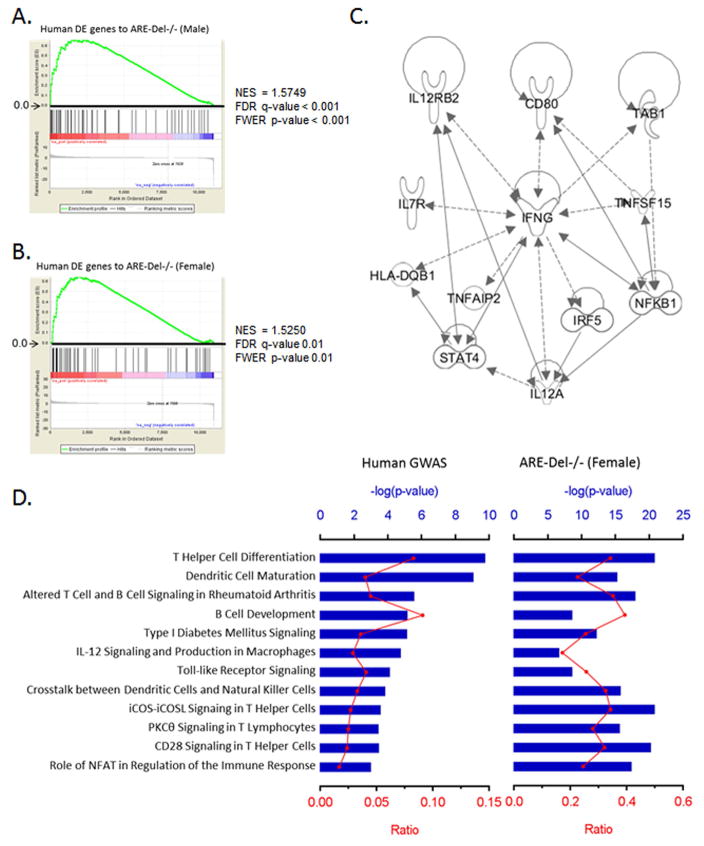
Figure 6.
Comparison of the gene expression profiling to human data from PBC patients. 6A–B. GSEA enrichment plots for human DE genes in PBC-BEC lesions using gene sets of male (A) and female (B) ARE-Del−/− mice. NES; normalized enrichment scores, FDR; false discovery rate, FWER; family-wise error rate. 6C. Top network identified by IPA for the most significant 26 variants. The lines between genes represent known interactions (solid line for direct interaction; dashed line for indirect interaction). 6D. Canonical pathways of human GWAS with ARE-Del−/− mice. The most significant 26 variants were selected by the NHGRI GWAS catalog (p ≤ 1 x 10⁻⁵). Top canonical pathways of these genes were derived from ingenuity pathway analysis (IPA) and compared with ones from female ARE-Del−/− mice. Ratio (bottom y-axis, yellow line) refers to the number of genes from dataset divided by the total number of genes that make up that pathway from within the IPA knowledgebase and the -log of P value (top y-axis, bar) was calculated by Fisher’s exact test.

