Fig. 5.
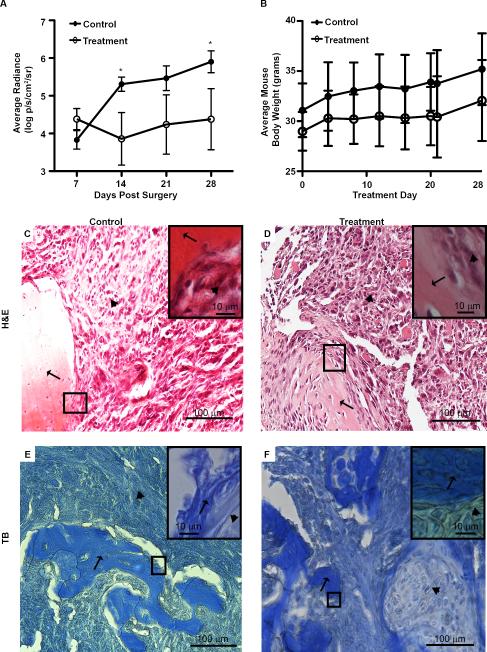
In vivo efficacy of MMAEp. A: Bone tumor growth curves. Luminescence values are log transformed. Data are presented as mean ± SEM of n=10 mice per group. * p<0.05 compared to control. B: Average mouse body weight over the course of experiment. Data are presented as mean ± SD of n=10 mice per group. C to F: Representative hematoxylin and eosin staining and toluidine blue staining of mouse bone tumors. Black arrows indicate areas of the bone; arrowheads indicate areas of the tumor. H&E: hematoxylin and eosin; TB: toluidine blue.

