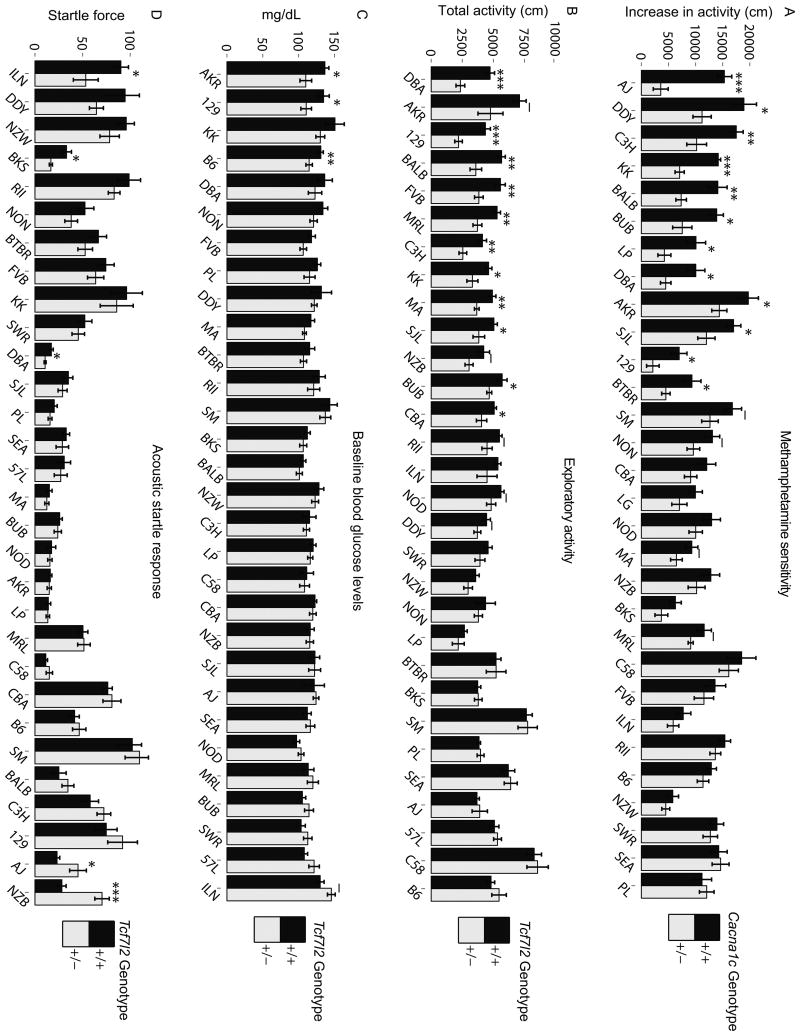
Figure 2.
Null allele phenotypes on 30 different genetic backgrounds. (A) Locomotor response to methamphetamine in Cacna1c +/- and +/+ mice. On days 1 and 2 a saline injection was given before a 30 min exposure to an open field. On day 3 methamphetamine (2 mg/kg i.p.) was given prior to the same open field test. The difference in locomotor activity on day 3 compared to activity on day 2 is shown. (B) Exploratory activity during a 30 min open field test in Tcf7l2 +/- and +/+ mice. (C) Baseline blood glucose levels in Tcf7l2 +/- and +/+ mice. (D) Startle response to a 120-dB acoustic stimulus in Tcf7l2 +/- and +/+ mice. Bars show the mean phenotype +/- s.e.m.. F1s are labeled according to the maternal strain, and are ordered along the x-axis according to the difference between +/- and +/+ mice. See also Table S3. Null allele effects within strains were evaluated using two-tailed t-tests. _p<0.1, *p<0.05, **p<0.01, ***p<0.001. –p<0.1, *p<0.05, **p<0.01, ***p<0.001.

